Case Study – Interpretation of VO2max Test
In the last blog posts the physiology and proper testing protocols for maximal oxygen consumption have been discussed. The purpose of this post is to walk through the analysis of a completed VO2max test and determine how the participant compares to others based on standardized VO2 charts. Next week how to establish some workouts toContinue reading "Case Study – Interpretation of VO2max Test"

In the last blog posts the physiology and proper testing protocols for maximal oxygen consumption have been discussed. The purpose of this post is to walk through the analysis of a completed VO2max test and determine how the participant compares to others based on standardized VO2 charts. Next week how to establish some workouts to improve VO2max will be discussed. Remember, a VO2max requires a maximal effort which can be completed with a multitude of approaches (e.g., a treadmill, cycle ergometer, or even a track if the O2 analyzer is portable) the goal for the exercise is make it continuously more difficult until the participant cannot increase their intensity any further. The exercise should last between 8-12 minutes. At a minimum, monitoring O2 consumption and heart rate is required for the determination of VO2max but this data can be supplemented by monitoring speed/power, expiration of CO2, and/or muscle oxygenation values.
Data visualization
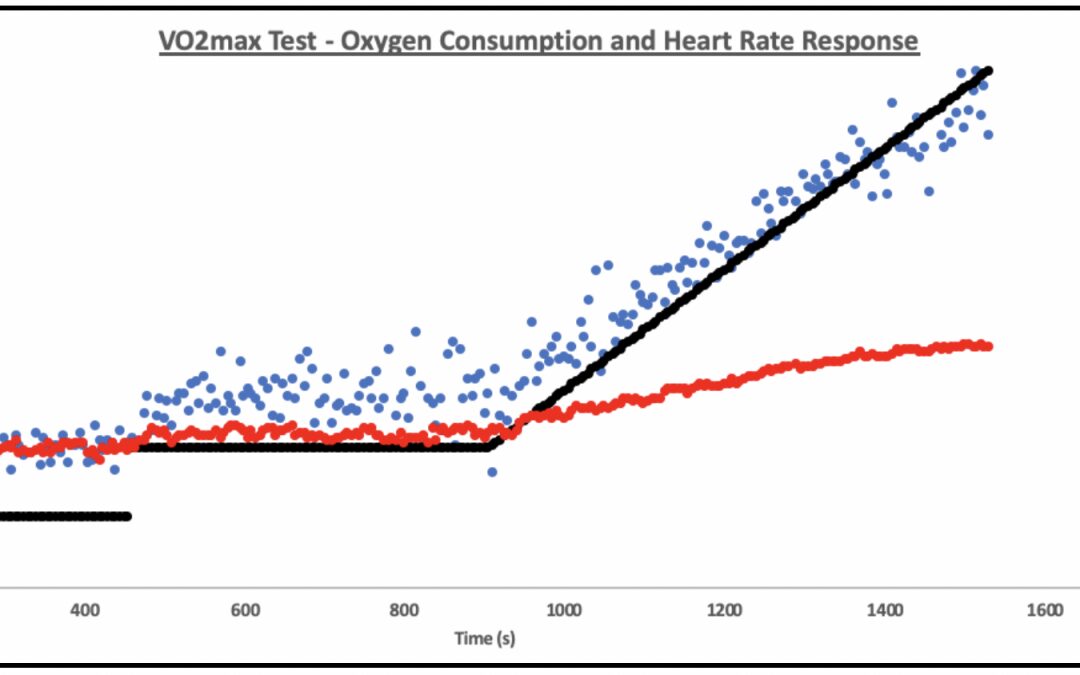
The following example was a VO2max test completed on a trained cyclist. They started with two 7.5 minute stages (50- and 100- watts, respectively, to measure efficiency), after finishing the second 100w stage, the power was increased by 26 watts per minute until they could not maintain a cadence > 55rpm. When analyzing a VO2max test there are two main options for visualization. The first is shown in figure 1 where power, oxygen consumption, and heart rate are all graphed against time. This graph gives you an easy way to visualize and compare each of the different variables, however, with all the data it can become a little overcrowded.

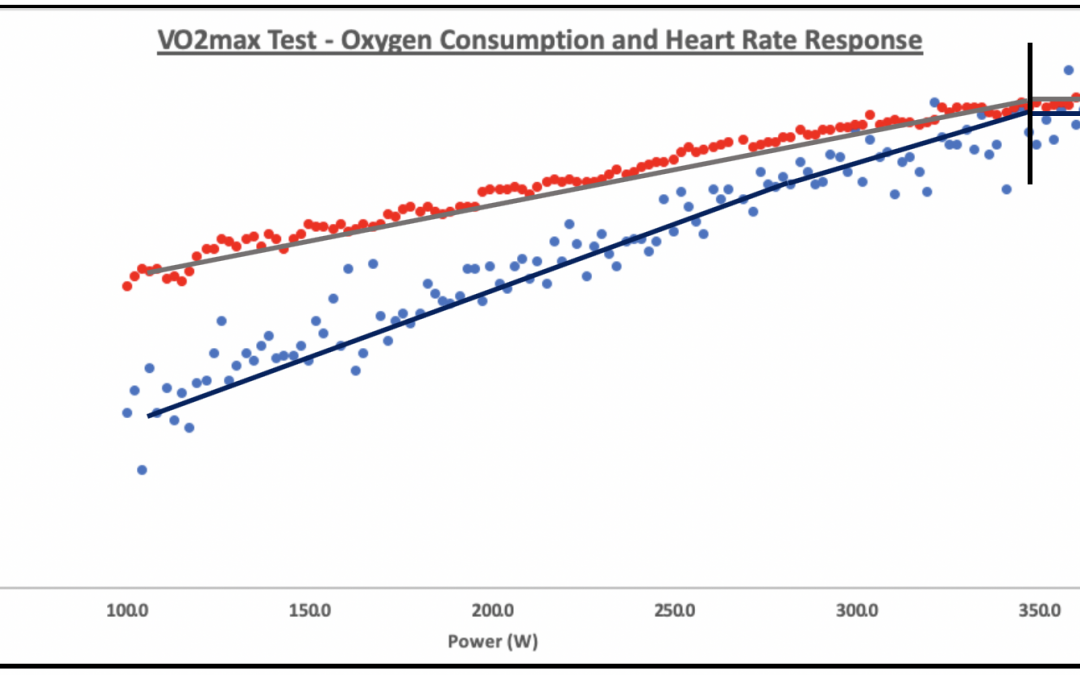
The second option is shown in figure 2 where oxygen consumption and heart rate are graphed against power output. This minimizes the data displayed on the graph but limits the amount of analysis that can be completed during the submaximal constant load stages.

When visualizing and beginning analysis of VO2max I prefer figure 2 because it places heart rate and VO2 close to the same scale allowing for better visualization of how oxygen consumption and heart rate can plateau at the end of intense exercise.
Determining VO2max
Visualizing how the body is responding to increasing exercise intensity/load is always a good first check for a VO2max test. You should see that heart rate and oxygen consumption increase at a similar rate, until the end, where both start to level out. The next thing to do is determine VO2max.
For Coaches
Determining VO2max can be as simple as taking the highest 5s average during the end of the test. From a test to test basis for coaches this is probably adequate because you are simply comparing an athlete to themselves, repeatedly, as long as this method remains consistent then you should be able to determine change over time.
For Researchers
If VO2max testing is being completed in a lab/research environment then other, more in-depth analysis should occur. During VO2max testing protocol determination (insert hyperlink here) the researcher should first determine secondary criteria (e.g., heart rate within 10% of age predicted heart rate max and respiratory exchange ratio [RER] > 1.10.) however, Poole and Jones 2016 warn that this secondary criteria is not adequate for determining if VO2max was truly reached. Furthermore, during a VO2max test a plateau in oxygen consumption may not occur in subsets of the population who are less trained, thus determining if VO2max is actually attained requires a second verification test. This secondary verification test should include either 1) a three minute constant power (110% PPO) test or 2) a three-minute critical power test. Both of these tests are designed to elicit VO2max thereby verifying if VO2max was truly reached during the first test. If a plateau in VO2 is reached during the first incremental test AND the VO2 elicited during the verification test is LESS THAN that of the VO2 elicited during the first test THEN to determine VO2max, the researcher should take the most stable (slope of close to 0) average of the VO2 over the longest time possible ( > 30s) and use that as the athletes VO2max. If a plateau is not reached but is higher than that elicited from the verification test then you can still proceed to determine VO2max from the guidelines above. If a plateau is not reached, and the verification test elicits a higher VO2 then you can determine VO2max from the second test, or do the incremental ramp test again.
How does this value compare?
From the above example the most stable portion at the end of the test was the last 35 seconds (placed within the black lines in figure 2) which lead to a VO2max of 61.2 mL/kg/min. Taking this value, and some other demographics (i.e. age and sex) you can see how this participant compares to their peers by going to the Kansas University Medical Center Website. This website puts this person’s VO2max in the 98th percentile. The conclusion being that this participant has a high VO2max, which should be maintained through training but the athlete may improve more by focusing on improving other aspects of fitness like threshold power.
Conclusion
VO2max testing is a very accessible evaluation of a person’s cardiorespiratory function. These tests start with some submaximal stages (to measure efficiency) then ramp up for 8-12 minutes until the participant cannot increase their intensity any further. Analyzing a VO2max test can be tricky, as a plateau in oxygen consumption may not be reached. Therefore, some of the biggest names in exercise physiology recommend that a secondary verification test should be completed to ensure a participant reaches a true max. To determine VO2max, the researcher should take the most stable (slope of close to 0) average of the VO2 over the longest time possible ( > 30s) and use that as the athletes VO2max. This is a more accurate representation of the athlete’s true fitness, rather than using a 5 sec average which could be inflated by hyperventilation or other confounding variables.
