Debunking the Lactate Threshold Myth
Many physiologic testing protocols in use today are based on poor science, and do not make use of the available evidence, which has proven fundamental errors in the protocols themselves. The continued propagation of the myth of a lactate threshold is just one example. Dr. Andrew Sellars, Co-Founder VO2 Master Inc. Lactate Does Not PlayContinue reading "Debunking the Lactate Threshold Myth"

Many physiologic testing protocols in use today are based on poor science, and do not make use of the available evidence, which has proven fundamental errors in the protocols themselves. The continued propagation of the myth of a lactate threshold is just one example.
Dr. Andrew Sellars, Co-Founder VO2 Master Inc.
Lactate Does Not Play a Negative Role
The popular opinion that lactate is a negative byproduct of glycolysis and leads to both fatigue and muscle pain has been called into question since the 1970’s, yet still has a foothold in the hearts and minds of many athletes and coaches. Researchers like L.B. Gladden and R.A. Robergs have published review articles in the Journal of Physiology expanding the ideas that lactate acts as a buffer to physiologic acidosis, and a valuable fuel source for working muscles. However, there remains constant references in popular media to the “lactate burn” and “lactic acidosis” when athletes are seen to falter at high intensity.
In Gladden’s research, he notes, “Lactate can no longer be considered the usual suspect for metabolic ‘crimes’, but is instead a central player in cellular, regional and whole-body metabolism.”i
Historically, the understanding was that lactate—a molecule that results from glucose metabolism—was a negative byproduct high-intensity exercise. It has been attributed to a primary cause of muscle pain and fatigue. However, there’s no good evidence that lactate has a negative role in the body. Rather, lactate, which is similar in structure to a shortened glucose molecule, is a powerful fuel source for working muscles, used by the brain as an energy source, and a necessary intermediate step in the refuelling of glycogen stores in the liver. If you recognize that lactate is the equivalent of half of a glucose molecule and is a source of fuel for certain processes in the body, it can’t possibly be continued to be viewed as a negative byproduct. Rather, the accumulation of lactate should only be used as an indicator that the process of glycolysis, the breakdown of glucose to provide energy, is being used to provide the energy required for high intensity exercise. Even though high lactate levels occur in association with fatigue and potentially muscle soreness, the lactate itself is not causal.ii
The Science Behind Lactate Production
A simple explanation of lactate production is that the more sugars that are broken down, the higher the lactate level will rise. If you do a standard step test, eventually you will reach a stage where your lactate levels will increase. Historically, taking that step test and taking lactate levels every three minutes showed that above a particular level fatigue would set in and people would no longer be able to perform at the same intensity. The concept of a lactate threshold is relatively easily disproven by comparing the results of an athlete on two step tests with different step durations; say, three minutes for the first and four minutes for the second. By testing lactate at the end of each step, an observer will see different curves emerge. We would argue therefore, that if one can manipulate the curve by simply changing the duration of the testing intervals, that neither step test is valid in terms of ability to draw conclusions pertaining to training intensities or predictions for an athlete’s ability to sustain a given effort.
Lactate is formed from the pyruvate that is produced as a product of glycolysis. The glycolysis reaction progresses as follows:
Glucose + 2 NAD + 2 ADP + 2 Pi → 2 Pyruvate + 2 NADH + 2 H+ + 2 ATP + 2H2O
The above equation clearly shows that NAD+ is required for glycolysis to occur. To keep the glycolysis reaction going, the NADH produced must be regenerated back into NAD+ so the reaction can continue to produce energy for the cell. It also demonstrates that H+ ions are produced in the formation of energy from the glucose, which contributes to the “acidity” in the cell. This is where lactate comes in. An enzyme called Lactate Dehydrogenase (LDH) is able to convert the pyruvate into lactate and at the same time converts the spend NADH back into the NAD+ that glycolysis requires.
Pyruvate + H+ + NADH → Lactate + NAD+
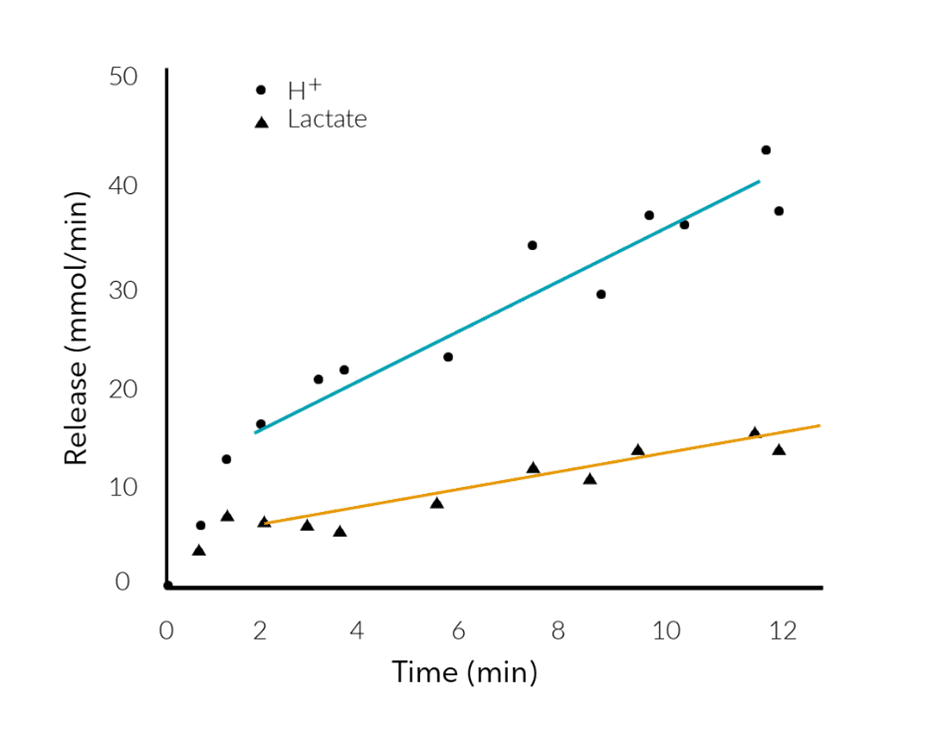
And from this reaction one can clearly see how lactate in fact buffers the acidity produced by glycolysis. At physiologic Ph, lactate acts as a buffer to hydrogen ions, and DOES NOT contribute to the acidity. This is exemplified in Figure 1.0, below.

Clearly, muscle proton release was greater than lactate release, with the difference increasing with increases in exercise intensity with an almost twofold greater proton to lactate release at exhaustion.
Additional Problems with the Lactate Threshold Theory
The other problem with the theory of a threshold is that a quantifiable lactate value above which an athlete will become fatigued is not based on any rational science. This idea of a threshold, typically described as 4mmol of lactate, is a great example of how results from studies placed importance on a small series of test results to identify a trend, without clearly challenging the understanding of the physiology behind the results. Identified below, two simple demonstrations clearly show the problem with the myth of a 4mmol threshold.
- The more sugars an athlete has available–through high carbohydrate diets, or excess sugar intake–the higher the lactate levels will be. Give the same athlete a high fat, low carb diet, and their lactate levels will be greatly reduced under the same loads. This simple anecdotal demonstration has been demonstrated repeatedly and ignored repeatedly by those who continue to propagate the myth of a lactate threshold.
- Athlete testing done at rest after a large meal show a clear rise in lactate levels. What is more interesting, is that the day following a particularly taxing training session or race, these resting levels can be seen to rise to very high levels, well above 4mmol, and often higher than those same athletes experience during exercise testing. This is a demonstration of gluconeogenesis in action, as digested carbohydrates are absorbed from the GI tract, broken down, and transferred to the liver in the form of lactate to be stored as glycogen.iv
Athletes with well-developed peripheral muscle adaptations, with increased concentrations of mitochondria, which allow for greater oxidative metabolism, have a greater ability to use lactate as a fuel source. This means, that even when being tested a relatively high intensity, they do not demonstrate the “typical” rise in lactate seen in lesser trained individuals.
Some attempts at explaining the differences between various tests by applying a tangent to a curve have been made but have ultimately failed at supporting the notion of a lactate threshold. The same issue regarding the problem of predicting performance from a lactate curve is demonstrated again in the example of tests of various step durations.

The Lactate Balance Point
A clear understanding of the dynamics of lactate in the human body, and the variability that results from food intake and training stimulus, has allowed for the development of better testing methodology that eliminates the reliance on an absolute number, or a lactate curve. These more sophisticated methodologies rely on the observed trends of lactate at varying intensities, both above and below a sustainable intensity. When an athlete goes above this theoretical steady state intensity, lactate will begin to accumulate, and below that intensity, lactate levels will begin to diminish. Following these trends above and below that intensity will allow an investigator to clearly pinpoint the intensity at which lactate remains stable, and performance can be maintained. This has been termed a Lactate Balance Point (LBP), as described by physiologist and coach Juerg Feldmann in the late 1990’s and was further studied and adopted into other testing protocols to determine a Maximal Lactate Steady State (MLSS).
Conclusion
Because there are more sophisticated means of identifying changing patterns in oxidative metabolism with new equipment like Moxy Monitor which uses Near Infrared Spectroscopy (NIRS) to examine real time oxygen utilization at the local level, in conjunction with VO2 monitoring both during incremental step tests and at steady state intensities, the need for invasive lactate analysis has been made virtually obsolete.
Relying upon the theory of a threshold, or the mathematical analysis of the problematic lactate curve implies a lack of understanding of physiology and the metabolic process. While we can support the use of examining trending lactate levels to help determine a Balance Point, we cannot support the continued reliance on lactate threshold for prediction of performance.
References
i Gladden, L.B.; Lactate metabolism: a new paradigm for the third millennium; The Journal of Physiology (2004)
ii Robergs, R.A. et al; Biochemistry of exercise-induced metabolic acidosis; The Journal of Physiology (2004).
iii Robergs, R.A. et al; (2004)
iv Robergs, R.A. et al; Interaction among Skeletal Muscle Metabolic Energy Systems during Intense Exercise; The Journal of Physiology (2010).
v https://myheart.net/lactic-acid-2/lactic-acid-misconceptions-and-myths/
