In this article, you’ll learn in-depth about ventilatory thresholds, how they can be measured, and how they can be leveraged to improve athletic performance.
What are Ventilatory Thresholds?
Ventilatory thresholds (VTs) are important physiological transition points that allow us to better understand the exercise intensities at which optimal adaptations to exercise occur. Identifying the ventilatory thresholds will allow you to determine your individual training zones. Using this information, it is possible to tailor your workouts to achieve your desired results.
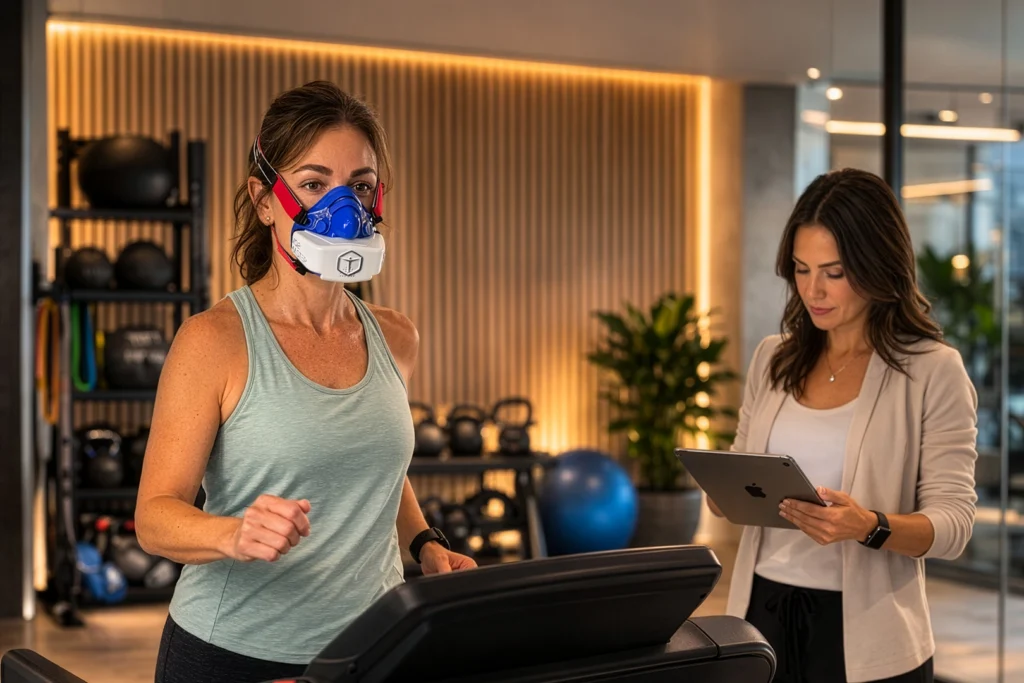
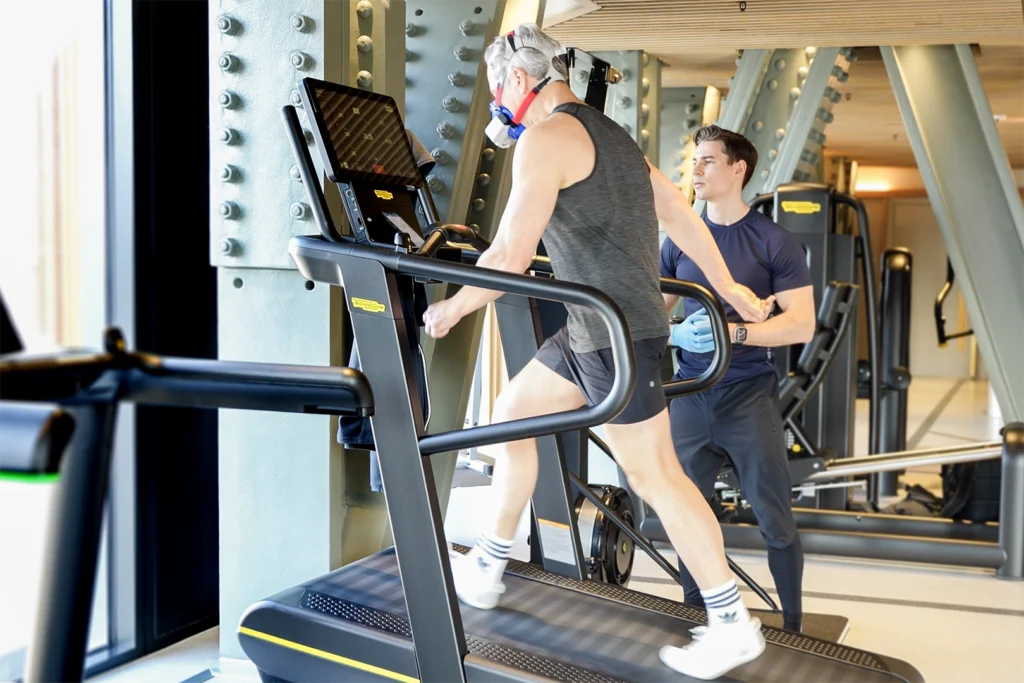
Ventilatory thresholds are determined during a graded exercise test (GXT), during which exercise intensities gradually increase from low to high. This gradual increase in exercise intensity allows us to measure how our bodies respond to varying degrees of exercise stress. A GXT will help us determine what exercise intensities are sustainable for longer periods of time, for shorter periods of time, and what is unsustainable. From this information we can accurately prescribe your individual training zones.
What are Training Zones?
Training zones represent different exercise intensities that can be prescribed to elicit specific physiological adaptations based on data collected during a VO2 max test. Training zones can be prescribed based on heart rate, speed or watts associated with the VTs and with VO2 max. We can also use other physiological measures such as SmO2 (muscle oxygenation) or blood lactate as a supplement to VO2 to inform optimal exercise / training intensities.
Prescribing training zones will allow individuals, coaches and healthcare professionals to accurately guide exercise routines and training programs for optimal physiological adaptations.
What do ventilatory thresholds represent?
During a Graded Exercise Test, there will be two exercise intensities where clear physiological transitions occur.
The transition points are named the first ventilatory threshold (VT1) and second ventilatory threshold (VT2).
VT1 – is the point at which we move from primarily fat oxidation, to increasing reliance on glycogen and glucose utilization. The intensity just below the VT1 is sustainable for extended periods of time. It is often called zone 2, aerobic base training, aerobic threshold training, or aerobic steady state. It is associated with a pace where a conversation can be maintained without significant difficulty. At VT1 we are primarily recruiting and developing the physiology of slow twitch fibers, which are essential to support longer sustained endurance performance, as well as recovery from high intensity efforts. Zone 2 training is well documented as having vast benefits, for human health, performance, and longevity.
VT2 – is the point where exercise intensity progresses from sustainable to unsustainable. The result is a marked shift in ventilation / breathing strategy. The intensity just below VT2 may be sustainable for relatively long periods (30-60minute) with difficulty, depending on an individual’s fitness level. VT2 is often referred to as the anaerobic threshold and may also be related to Functional Threshold Power (FTP).
VT2 is an important marker for athletes in endurance events requiring them to sustain a high level of output for longer periods of time (30-60+ minutes). Beyond VT2, we increasingly use fast twitch muscles to meet the demands of exercise. This results in a shift to using primarily glucose and stored glycogen as a source of fuel. Exercise output above VT2 is only possible for shorter periods of time before the build-up of hydrogen ions and other fatigue-related metabolites occurs causing muscle force production to decrease (i.e. we get tired).
Why are ventilatory thresholds important?
Performing a GXT to identify the ventilatory thresholds is critical for getting the most from your exercise or training program. This information can help enhance exercise and training in a number of different ways:
- Identifying the VTs can help a new exerciser or someone who is returning to exercise understand the intensity at which to exercise sustainably and safely.
- Measuring VT1 will allow you to identify your zone 2 corresponding heart rate and speed or wattage to train steady-state endurance at the optimal intensity. This allows for the correct amount of physiological stress to be applied without creating excessive fatigue which causes us to stop early or hinders us from continuing a training program. It is also likely to help individuals avoid overuse injuries resulting from going ‘too hard, too soon’ or ‘too hard, too often’.
- Knowing your VTs will allow you to identify a training zone where you can train to use fats for fuel and to spare glycogen. This can help your clients as part of a weight loss strategy, but also it can help you become more metabolically flexible.
- This approach will allow you to train smarter to mitigate the potential for training interferences that can occur when you train strength & endurance concurrently (in the same session or training block).
- Identifying VT’s and VO2 max will allow you to calculate individual training zones for specific training sessions (e.g zone 2, tempo, threshold / FTP, VO2 max intervals etc.)
VO2 metrics are critical for our understanding of the physiological response to exercise, in addition ventilation data can provide you with a more detailed picture of metabolic health and fitness and provide your clients and athletes with actionable data.
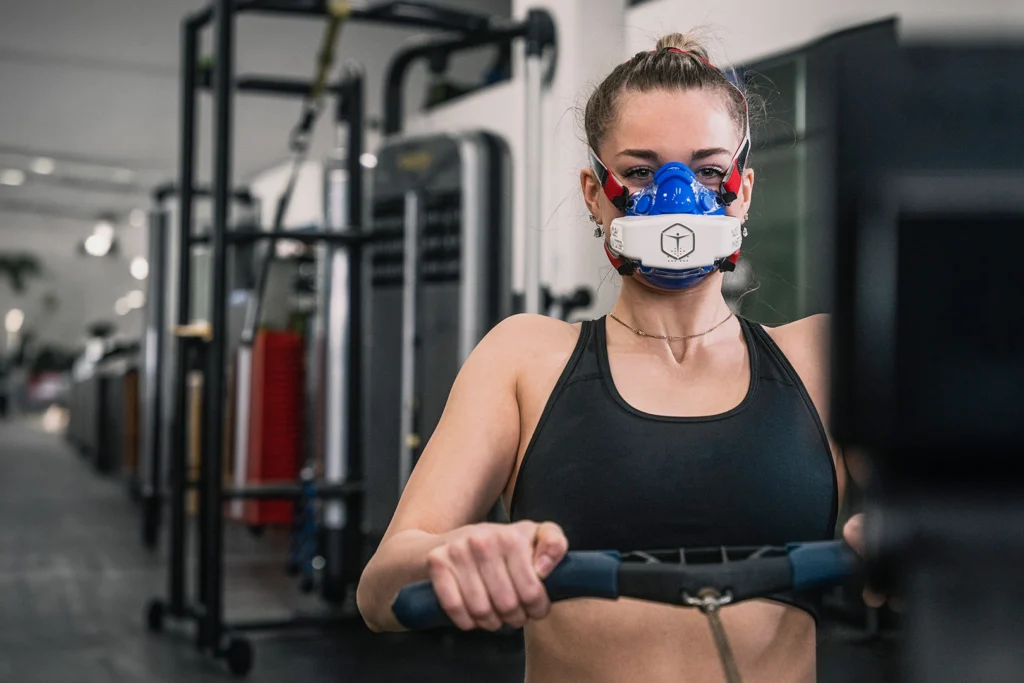
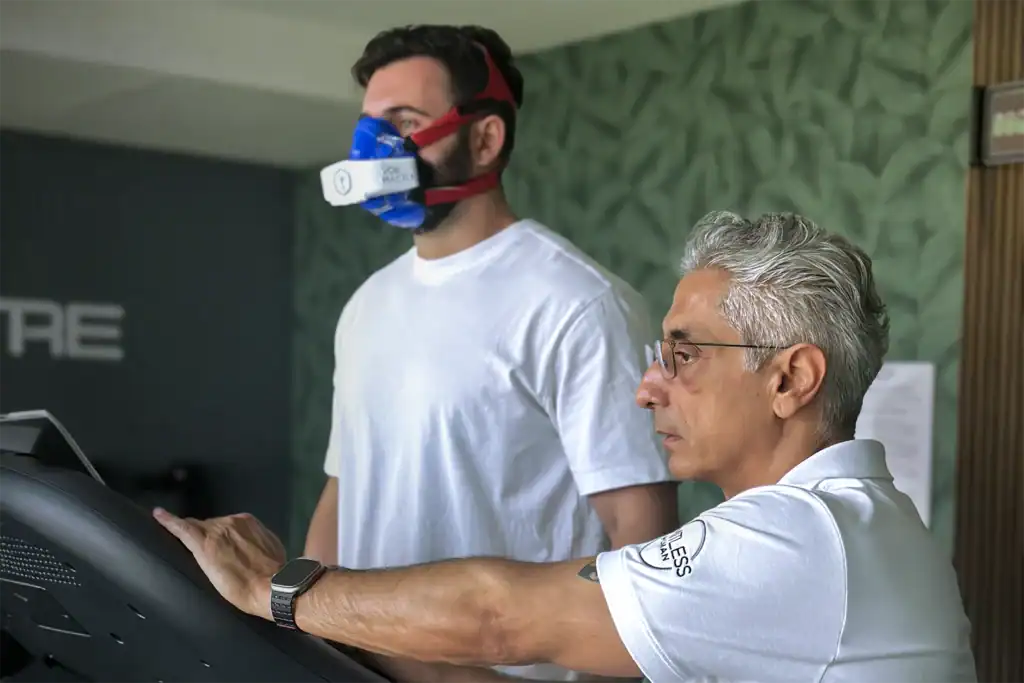
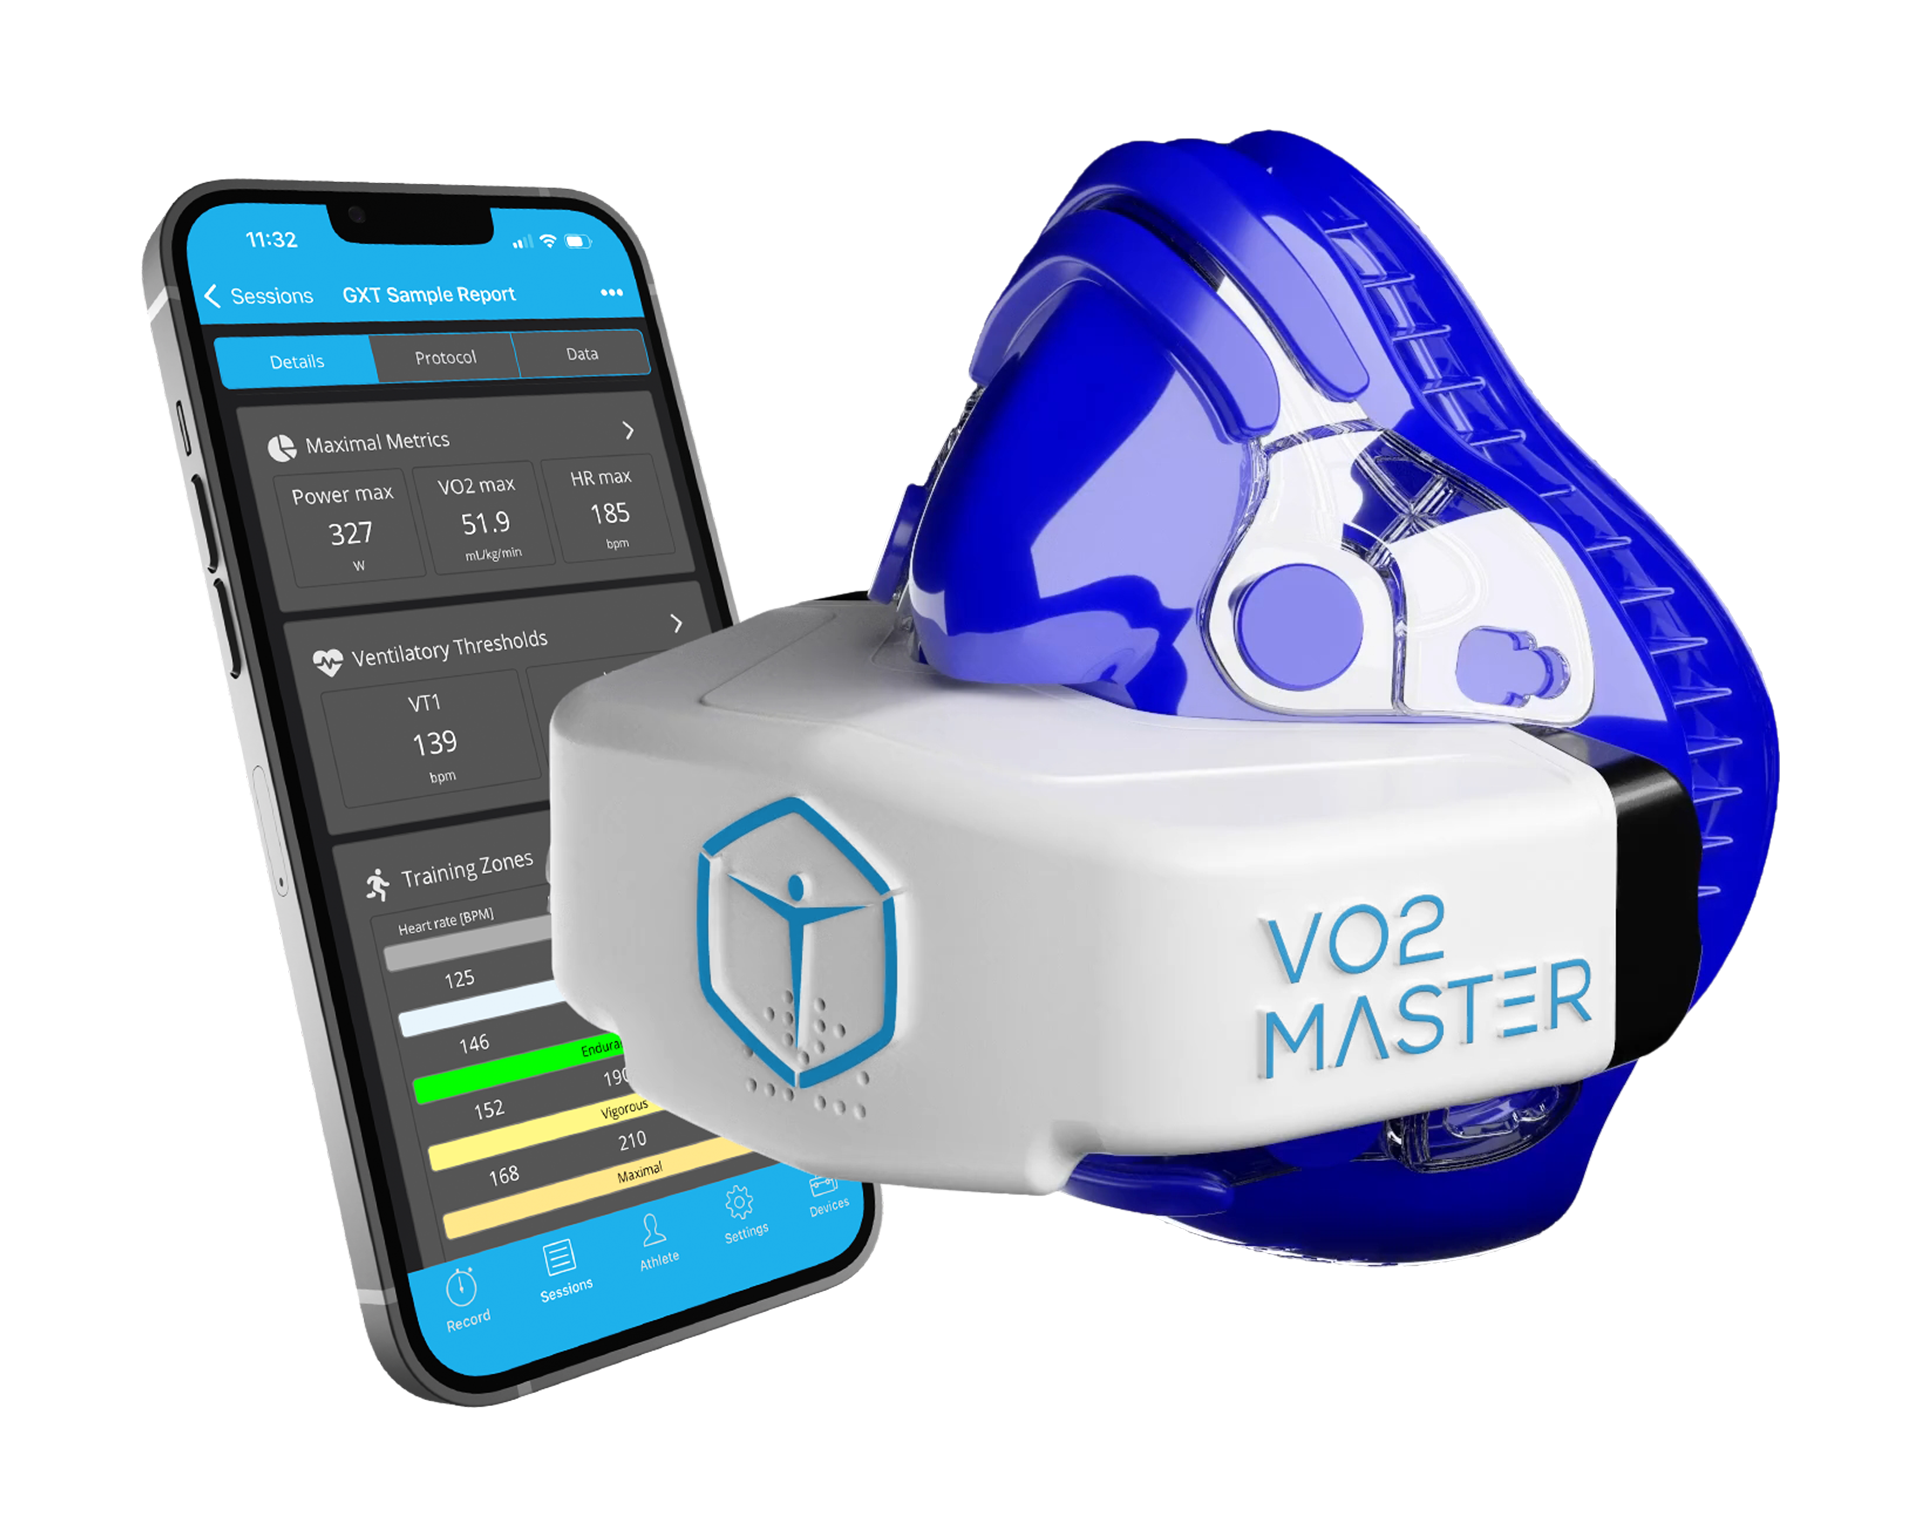
How do we identify the ventilatory thresholds using your VO2 Master Analyzer?
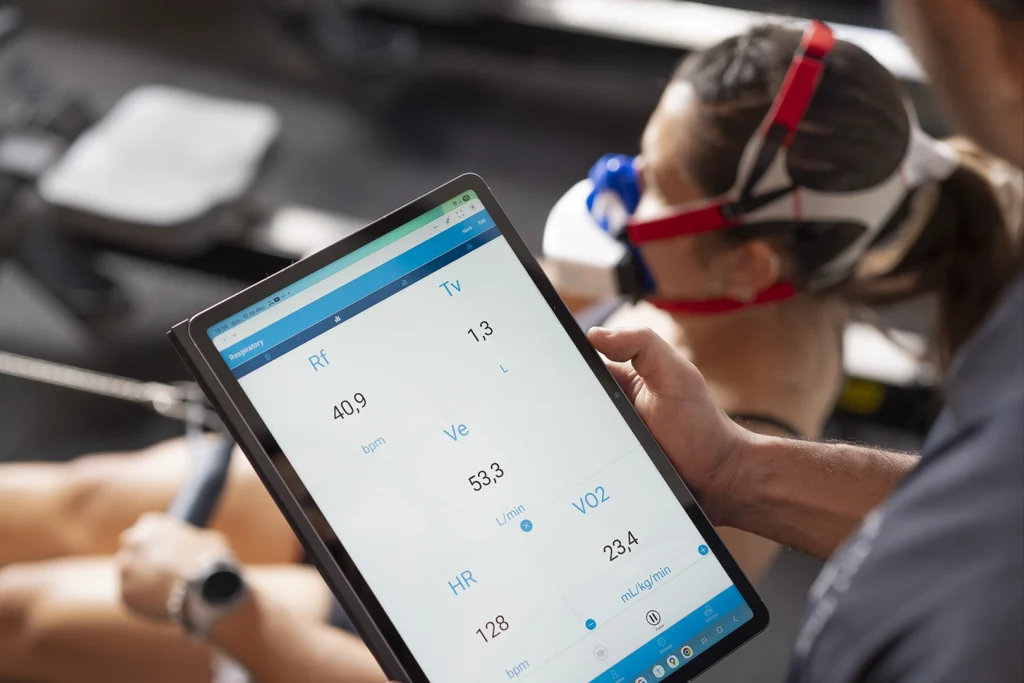
When testing with the VO2 Master, we will see the following data being collected / measured:
- Total air inhaled/exhaled per minute (Minute ventilation or Ve)
- Volume of air inhaled/exhaled per breath (Tidal Volume or Tv)
- The Frequency of breathing per minute (Respiratory frequency or Rf)
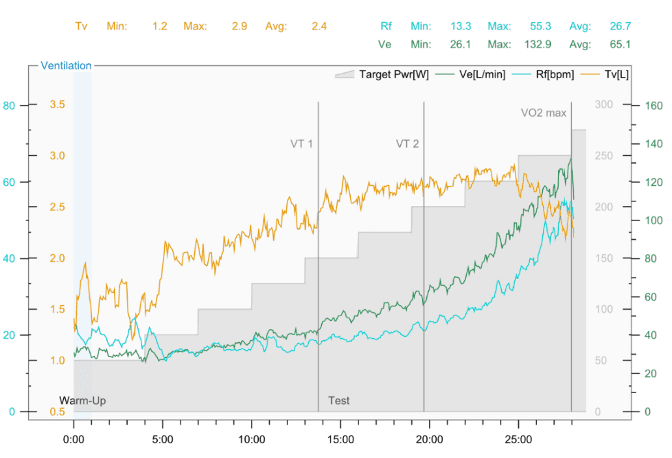
The classic way to identify the ventilatory thresholds is by determining 2 breakpoints in the minute ventilation (Ve) graph.
Identifying the VT1 and VT2.
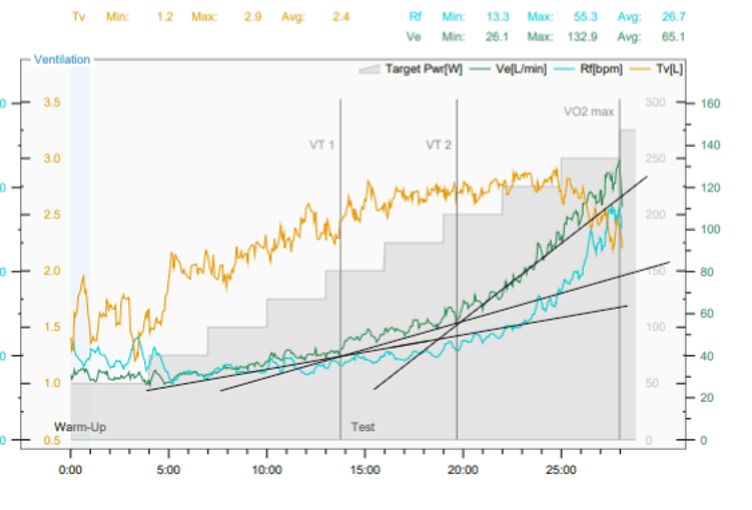
In the example below, a non-linear change or inflection point in the minute ventilation graph (green) can be observed at 14 mins and at 19.5 mins. This example shows the most typical pattern observed in ventilation data.
In the next example, the same graph is shown, this time including the straight lines which are drawn to illustrate the inflection points.
Other ventilation patterns used to identify the VTs
The Ve Slope method can be used to identify thresholds when a protocol is optimized (discussed later) and the test subject follows a typical breathing pattern. In some cases, the Ve graph will not have clear inflection points. In these cases, we can also use either Tidal Volume or Respiratory frequency to help locate the VTs.
VT1 is often associated with an increase in tidal volume. At VT1, a person often settles into a deeper breathing pattern. In the example below, while the Ve (minute ventilation) graph does not appear to break in terms of linearity, we can see a clear shift in Tidal volume at the 13-minute mark.
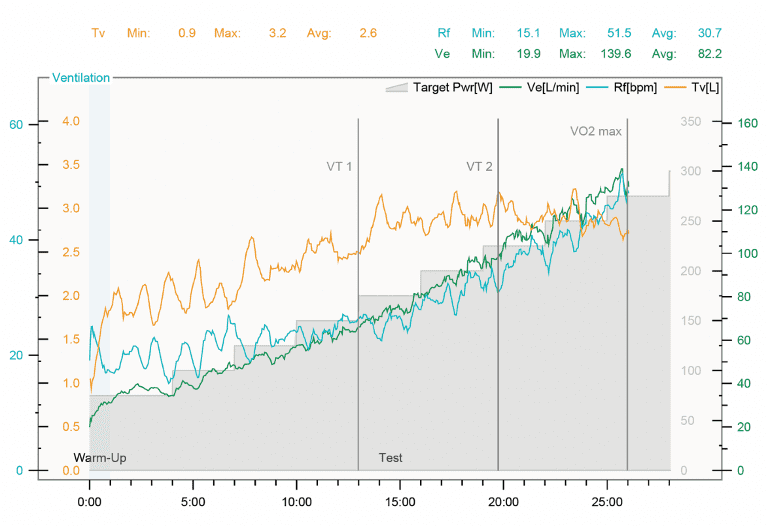
VT2 is often associated with a non-linear increase or spike in respiratory frequency and a levelling off or decrease in tidal volume. The graph below shows this relationship and the inflection point which corresponds to VT2:

In this case, VT2 occurred at 26 mins. An inflection point in the Rf graph is clear.
Using the VTs to establish training zones
It is important to identify VTs at the point where the transition in breathing strategy starts to occur as this signifies a physiological transition in response to load. Training zones 2 and 4 should be prescribed relative to the load and associated HR that occurred in the stage directly before the VT was detected.
Once we have established the transition point, associated HR and speed or watts can be established by drawing lines vertically through the ventilation graphs and the HR/VO2 graphs.
Then draw horizontal lines across from the intersection of time/HR to establish the associated heart rate and the speed or watts corresponding to this heart rate (detailed in the figure at the end of this section).
In most cases, the VTs are found in the following ranges as a % of HR max. Knowing this is helpful in some cases where the ventilation graphs are less clear:
VT1 – between 65-75% of HRmax
VT2 – Between 82-93% of HRmax.
Here are some common training zones and their relationship with the VTs:
- Zone 1: Recovery training. Usually light aerobic training at 50-60% of max heart rate and 10-15 bpm below the VT1.
- Zone 2: This intensity should be just below the VT1 (before the shift in ventilation occurs) and as such should be sustainable for relatively long periods of time without difficulty.
- Zone 3: The ‘grey’ zone. Training at this intensity has a higher energy cost, and therefore higher fatigue accumulation than zone 2 training.
- Zone 4: Functional Threshold Power / Tempo / race Pace: These are associated with stage before the VT2 occurred. The pace would be sustainable for a relatively long period with difficulty.
- Zone 5: VO2 max interval training – is generally performed at 90-95% VO2 max / Max HR for 3-8 minutes for multiple intervals.
- Zone 6: Max effort – usually sprints training or similar lasting 15-30 seconds with longer rest (2-3 mins).
The charts below illustrate the process of using the inflection points to identify the corresponding heart associated with the VTs.
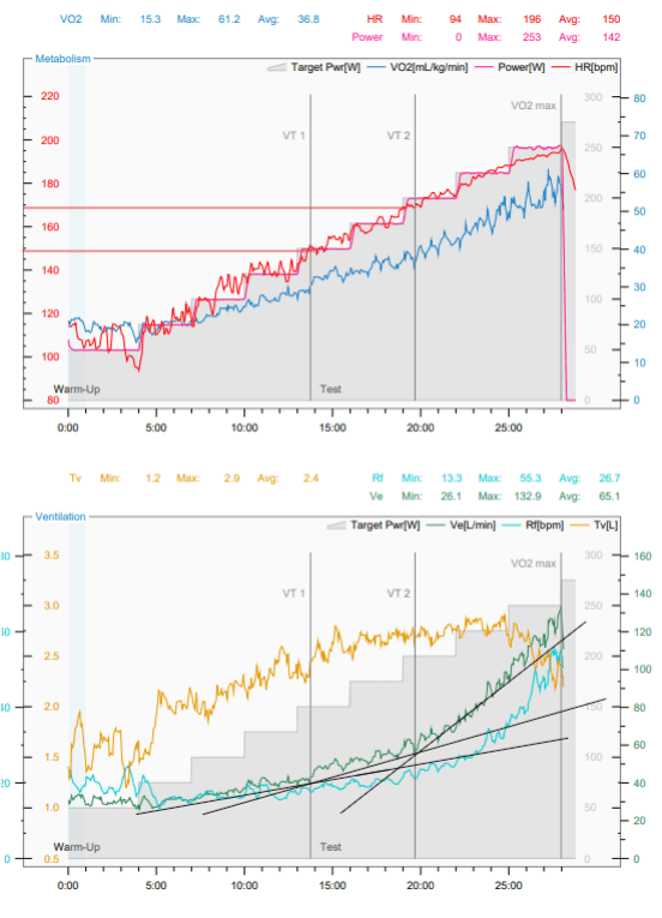
In this case, the maximal HR was 195 bpm. VT1 was established at an intensity corresponding to HR 147 bpm (75% of Hrmax). VT2 was measured at an intensity corresponding to HR 168 bpm (86% of HRmax). This athlete was prescribed zone 2 training 140-145 bpm and 125-135 watts.
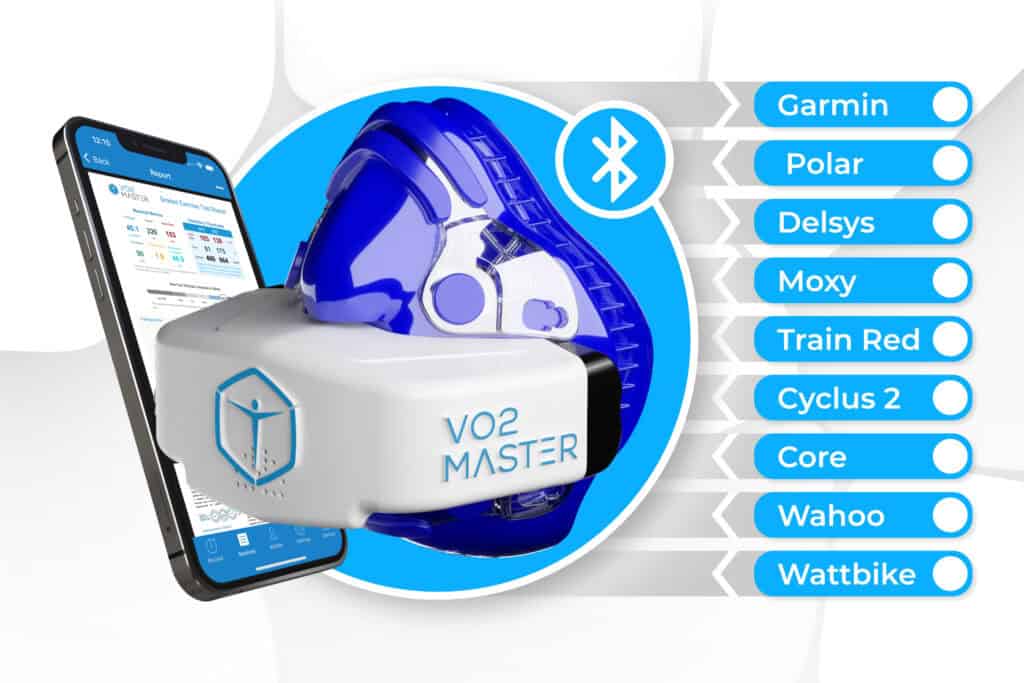
Using the VO2 Master Manager to Identify VTs
The VO2 Master Manger app has a built-in algorithm intended to detect the ventilatory thresholds. This algorithm will work when the test subject breathes in a predictable/typical way during testing and the protocol is optimized.
We do recommend that our customers learn how to verify the VTs using the method shown and not rely solely on an algorithm to compute VTs from complex and often unpredictable patterns of breathing. In many cases, the algorithm will work well but often there are too many unpredictable variables to manage.
How to Develop a Protocol for Successful Graded Exercise Testing and VT Identification
- The test should start at an intensity corresponding with a heart rate at or below 100 bpm. This low starting intensity will allow the detection of VT1. If the test is started at an intensity that is too high, you will likely miss VT1.
- The step duration should normally be 1-3 minutes in length. For most people, a 1 min step test is quite adequate. Longer steps allow homeostasis between oxygen supply and demand to occur, though it will be more challenging when undertaken to VO2 max.
- Total test duration should be between 8-15 minutes. If the test is too short, chances are you will miss VT1, or not achieve VO2max. If the test is too long, fatigue can play a larger role in the test which may result in lower power outputs or speeds being attained at VO2max.
Please note, if your goal is to identify the VTs and you do not need a VO2 max, your GXT protocol does not need to involve a maximal effort. In this case, you could run a sub-maximal test and stop 1-2 stages short of maximum effort (8-9/10 rating of perceived exertion). Sub-maximal tests are also a great way to introduce your client to physiological testing and may be more appropriate in the case of people who are less fit and/or have not performed high-intensity training.
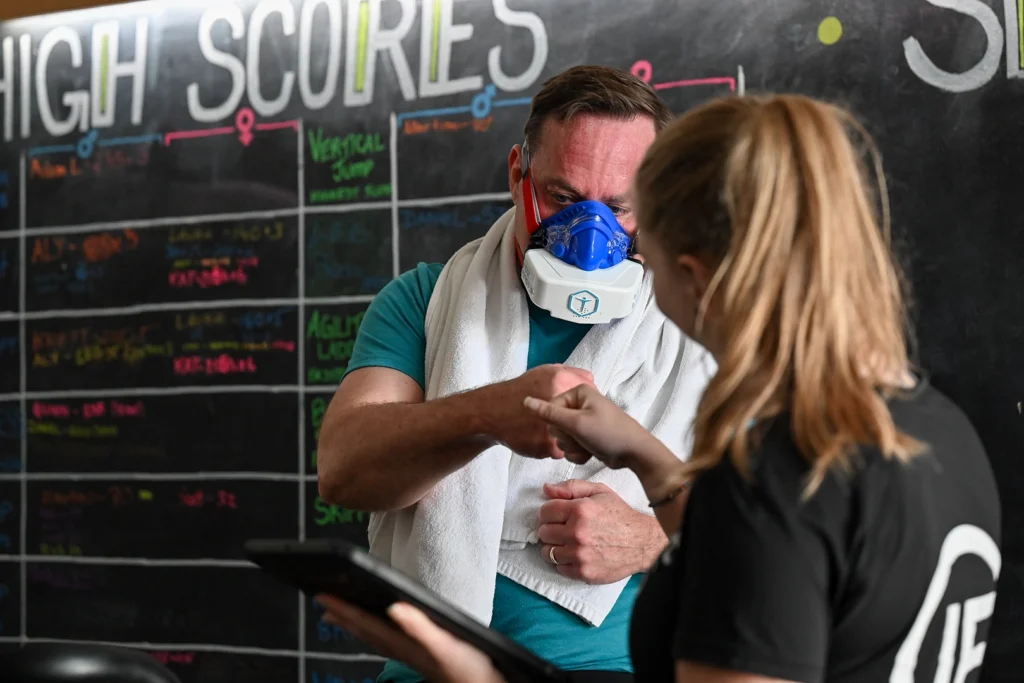
How can you use the ventilatory threshold data in practice?
Identifying the Ventilatory Thresholds is important for both health and athletic performance as it allows your client to dial in the appropriate exercise intensity for their individual physiology. Here are some more ways that the ventilatory threshold data can be used:
- To show an athlete, client, or patient how efficient their aerobic system is and then show them improvement in the physiological response over time (e.g. test every 4-6 weeks, how they improved).
- To establish training zones for a client.
- To compare with normative data (compare with others their age).
- To identify inefficient breathing patterns and then aim to address these with targeted training interventions.
Remember that test improvements will be related to the SAID principle (Specific Adaptations to Imposed Demand). As an example, to improve recovery capacity and aerobic efficiency, gradually increasing volumes of zone 2 training would be effective. However, following this training protocol, we would not expect to see a significant improvement in VO2 max.
In conclusion, we hope this article was helpful to you to better understand the ventilatory thresholds and how they relate to your testing protocols and to establish training zones for athletes, clients, and patients.
For more information, please contact our support team.