Ventilatory Thresholds
Significance of Ventilatory Thresholds During physical exertion, as the physical intensity increases, the production of CO2 ramps significantly as a result of the metabolism required to fuel the working muscles. The harder an athlete works, the more CO2 is produced. This CO2 production is the driving force for increased ventilation. In contrast to the linearContinue reading "Ventilatory Thresholds"
Significance of Ventilatory Thresholds
During physical exertion, as the physical intensity increases, the production of CO2 ramps significantly as a result of the metabolism required to fuel the working muscles. The harder an athlete works, the more CO2 is produced. This CO2 production is the driving force for increased ventilation. In contrast to the linear relationship of the heart rate in response to exercise intensity, ventilation typically remains stable for a range of intensities, until a point at which the ventilation pattern changes. This response is typically identified by two different significant shifts in breathing patterns, know as ventilatory thresholds (VT1 and VT2) which are key indicators used in training optimization.
First Ventilatory Threshold – VT1
VT1 is identified as the first significant increase in breathing that occurs as exercise intensity increases. It can sometimes overlap with other physiologic markers, such as lactate values rising, or muscle oxygenation values dropping. It has also been associated with the upper limit of the zone associated with free fatty acid metabolism, which indicates for some athletes the most efficient intensity in terms of weight loss.
Second Ventilatory Threshold – VT2
VT2 is the second threshold above which the rhythmic and controlled breathing pattern tends to break down, and an athlete is under significant duress. This threshold can also be associated with what has been called an anaerobic threshold or lactate threshold. This intensity clearly shows a disruption in the body’s ability to maintain control, and therefore the ability to sustain intensities above VT2 are significantly limited.
VO2 Master + VT Detection
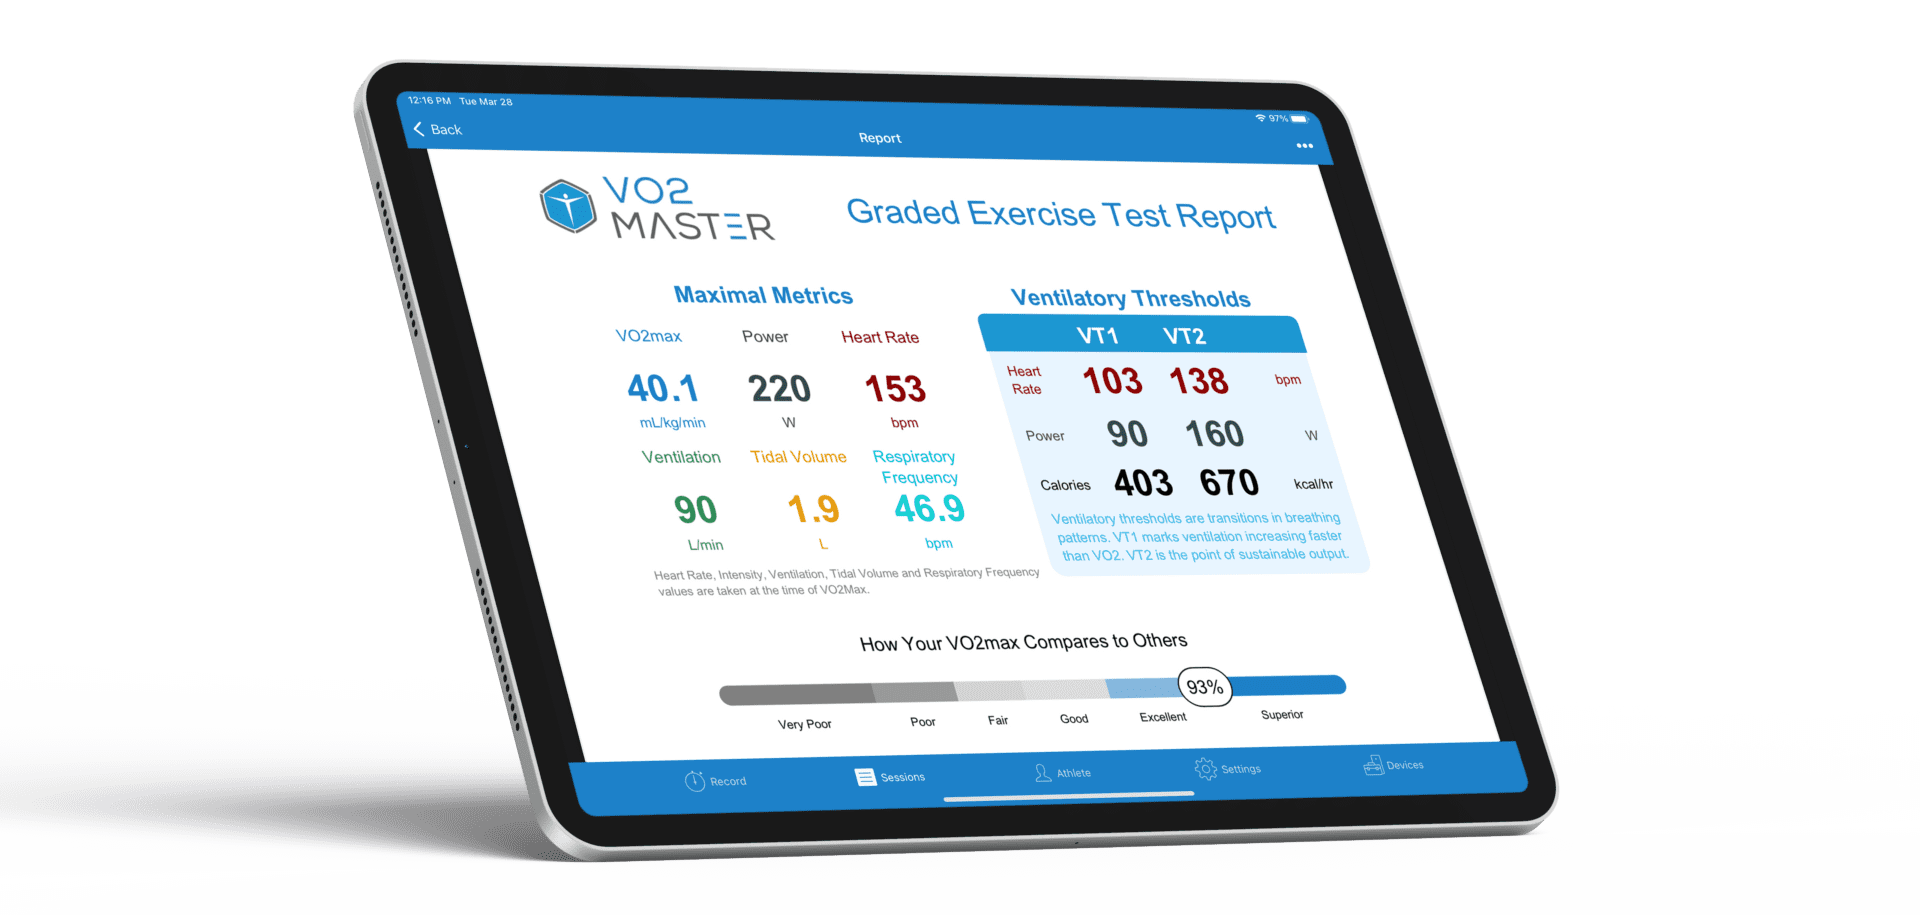
With the VO2 Master Analyzer and VO2 Master Manager mobile app, automatic VT identification can provide valuable insight for users who require both efficiency and precision in their analysis. While the automatic VT identification is very useful, in some cases, the data required may not always be captured to support this feature. This is why we provide a way for assessors to manually edit their reports and to input the necessary data to display VT1 and VT2. See section: How to Edit a Report
Best Practices for Automatic VT Detection
We recommend that each assessment has 8-12 steps (stages) in intensity which provides the optimal amount of data for the VT Detection Algorithm. Further, the athlete should start the assessment below a heart rate of 100 beats per minute (bpm) to ensure sufficient data is collected prior to reaching their first ventilatory threshold..
How to Edit a Report
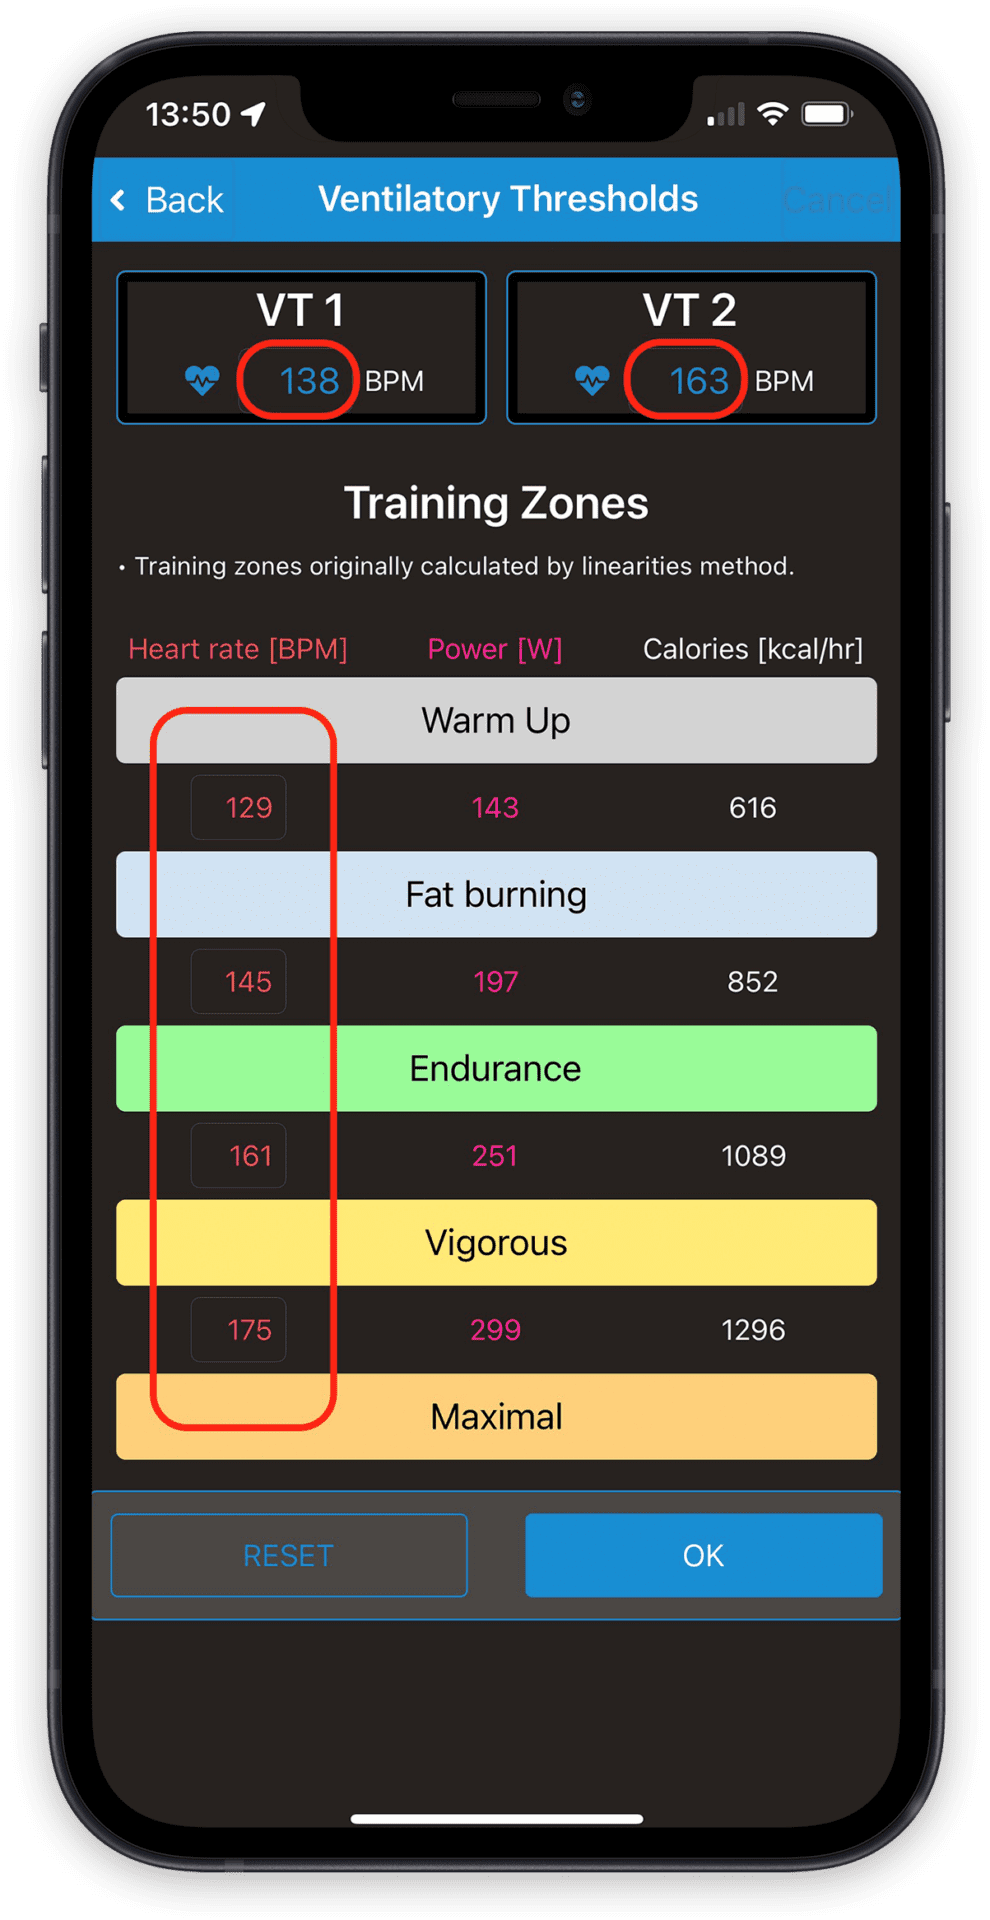
Please follow the steps detailed below if Ventilatory thresholds were not automatically identified, or you feel that it is necessary to manually edit the Thresholds or Training Zones.
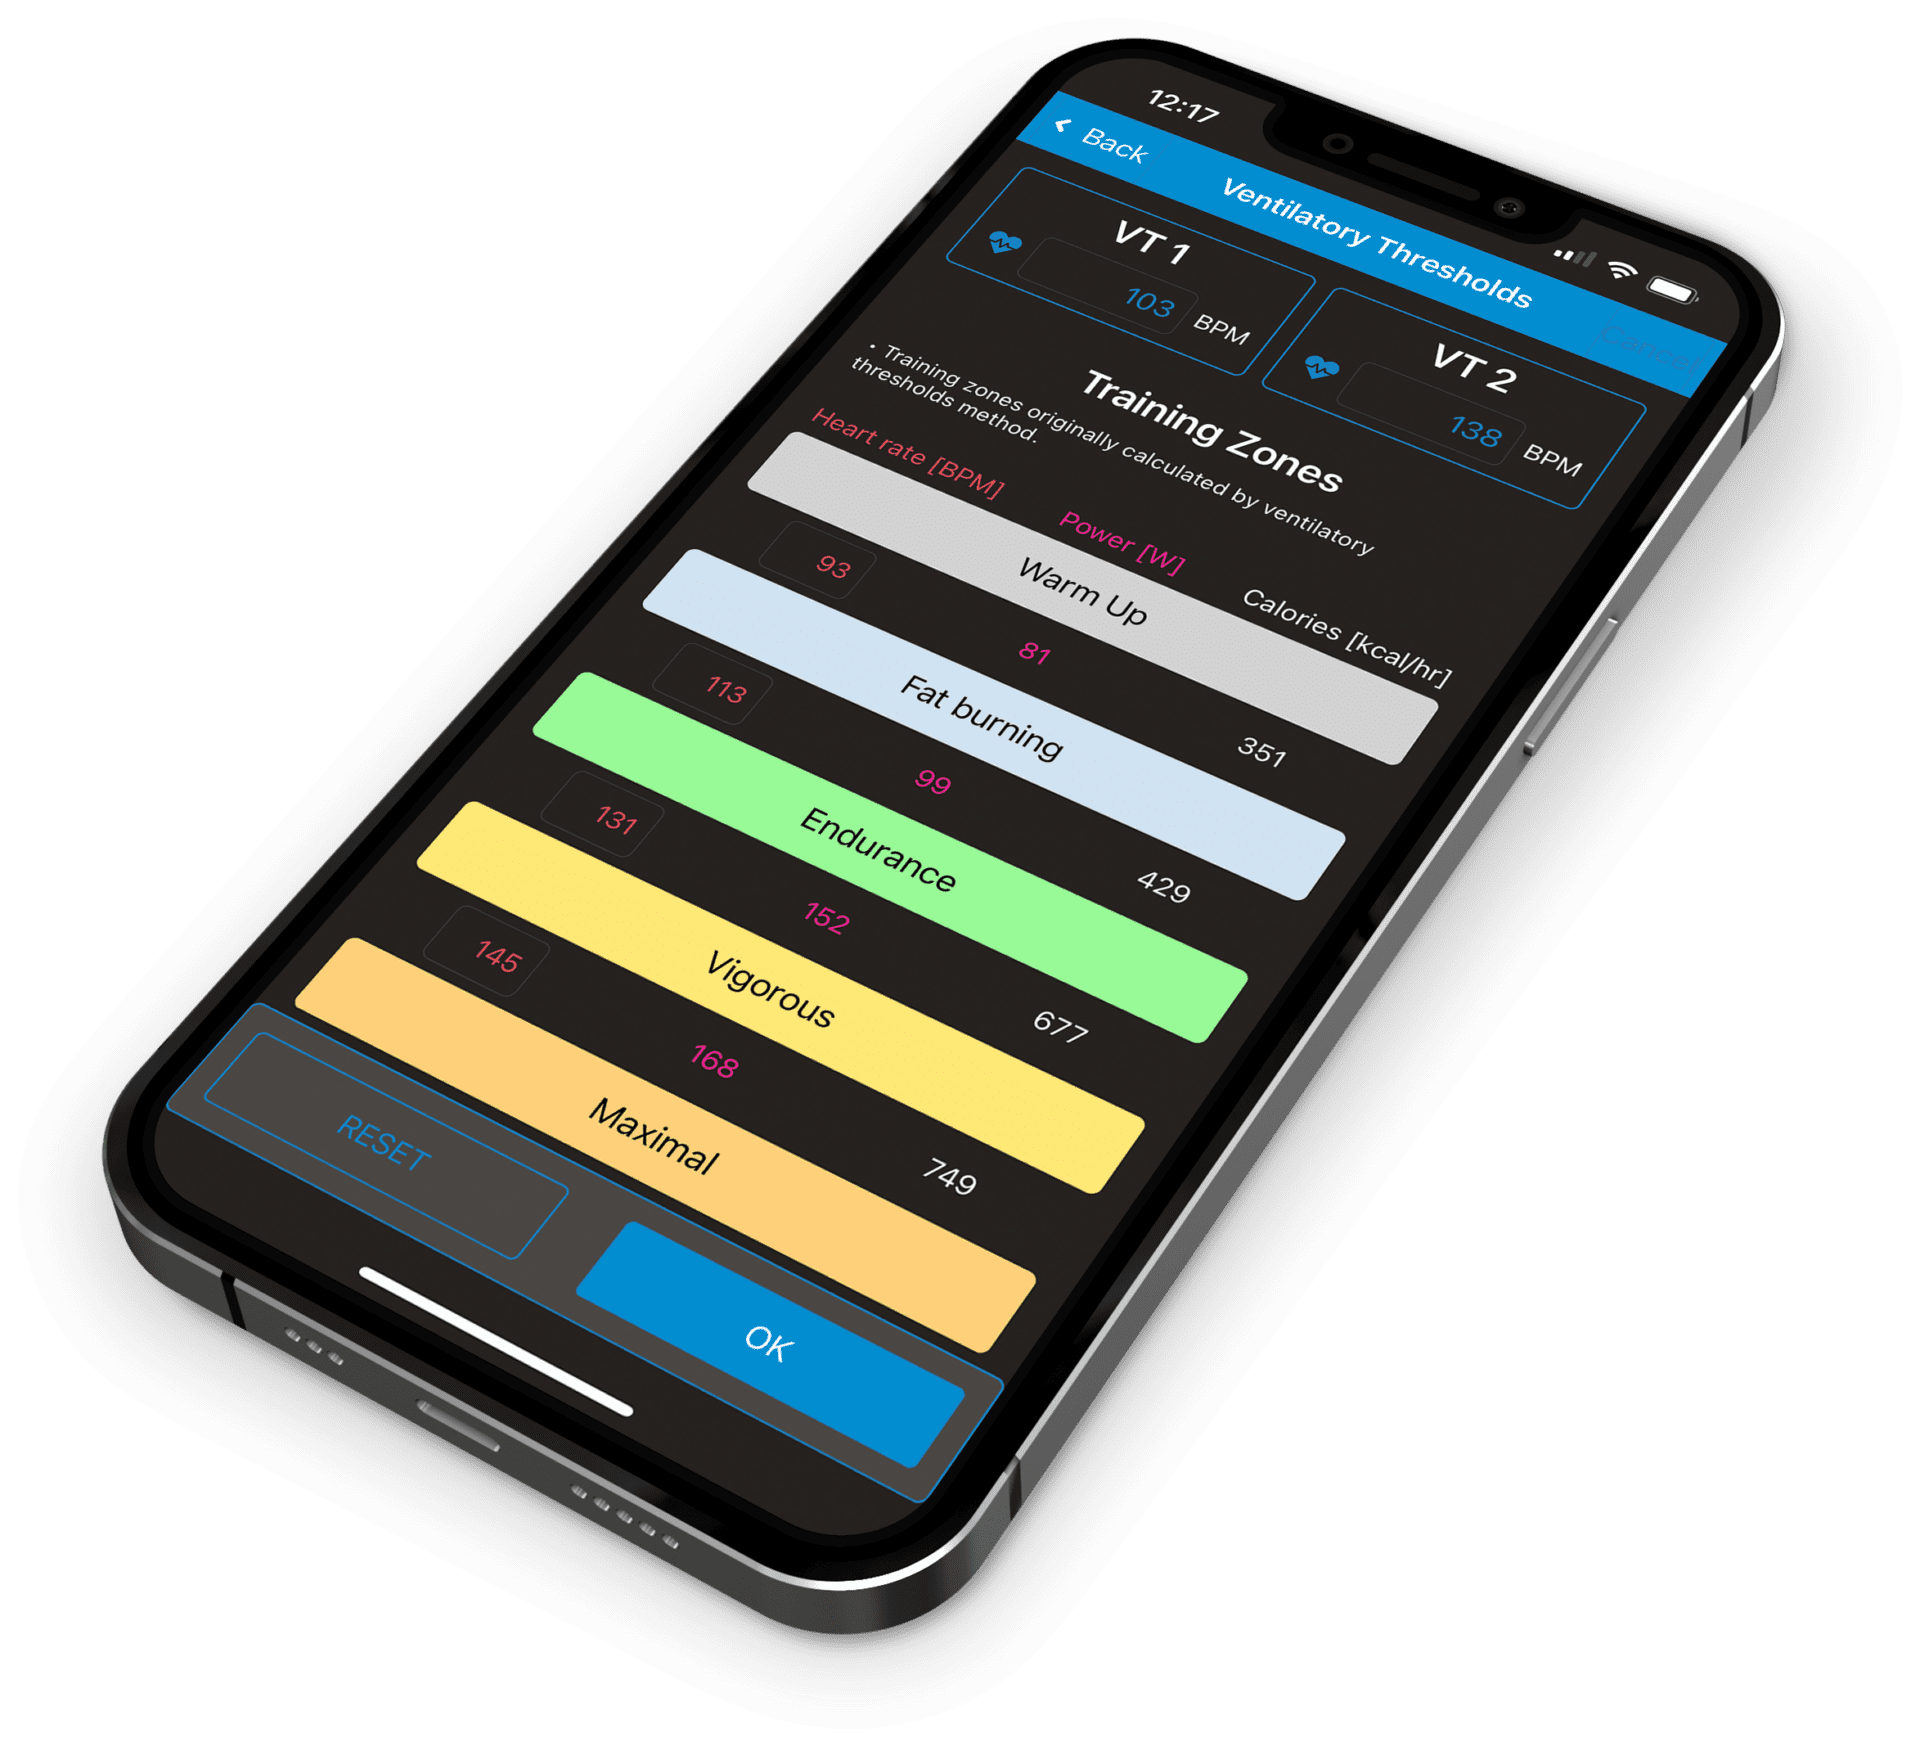
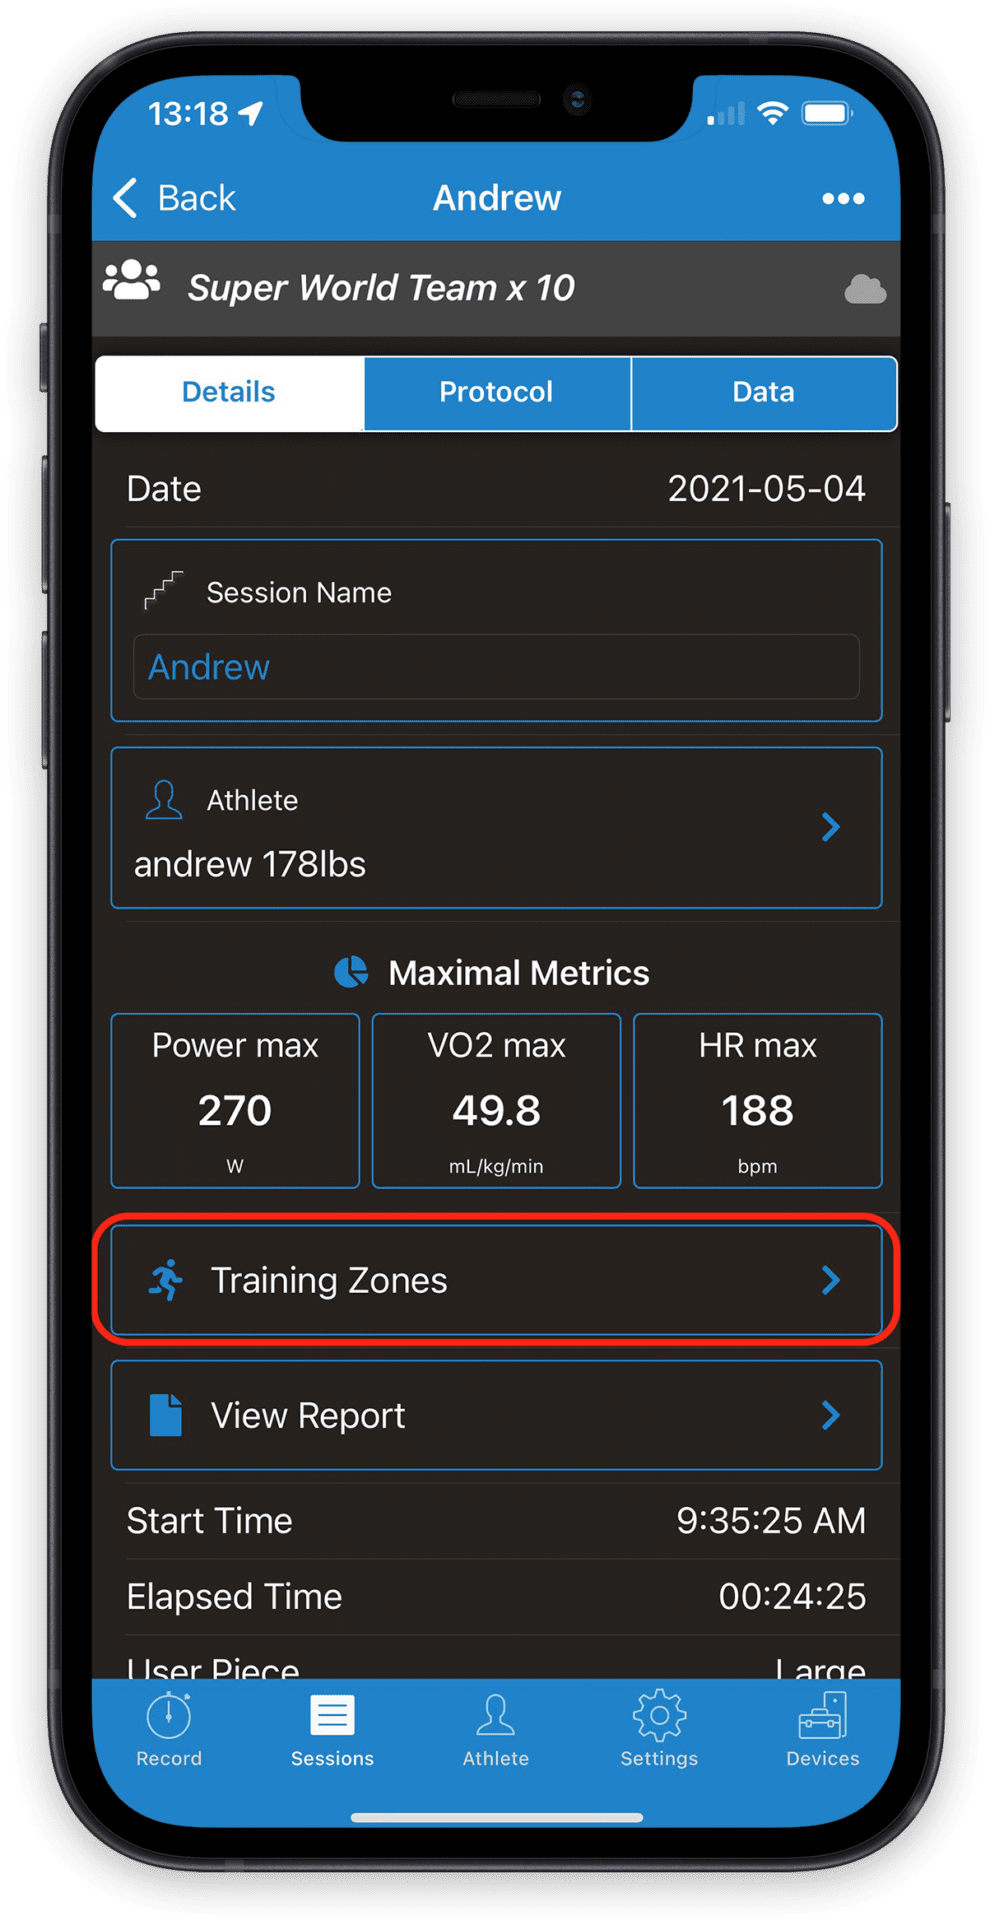
Tap on the Training Zones button in the review session page (figure 1.0) to manually input a heart rate value for each threshold (figure 1.1), as well as editing training zones.
How to Identify Ventilatory Thresholds from a Report
Step 1: Check for three straight lines with differing slopes in the ventilation curve in the second graph on page 3 of the report.
Step 2: Draw over these linearities with a pen. The transition points are the thresholds which correspond to a certain heart rate.
Step 3: Draw vertical lines from these transition points through the top graph. Draw horizontal lines from where each vertical line intersects with the heart rate line, to the heart rate scale. This denotes the heart rate value for each threshold.
Step 4: Enter these heart rates into the app and update training zones accordingly: the middle of Zone 2 (Z2) is the first threshold (VT1), middle of Zone 4 (Z4) is the second threshold (VT2).
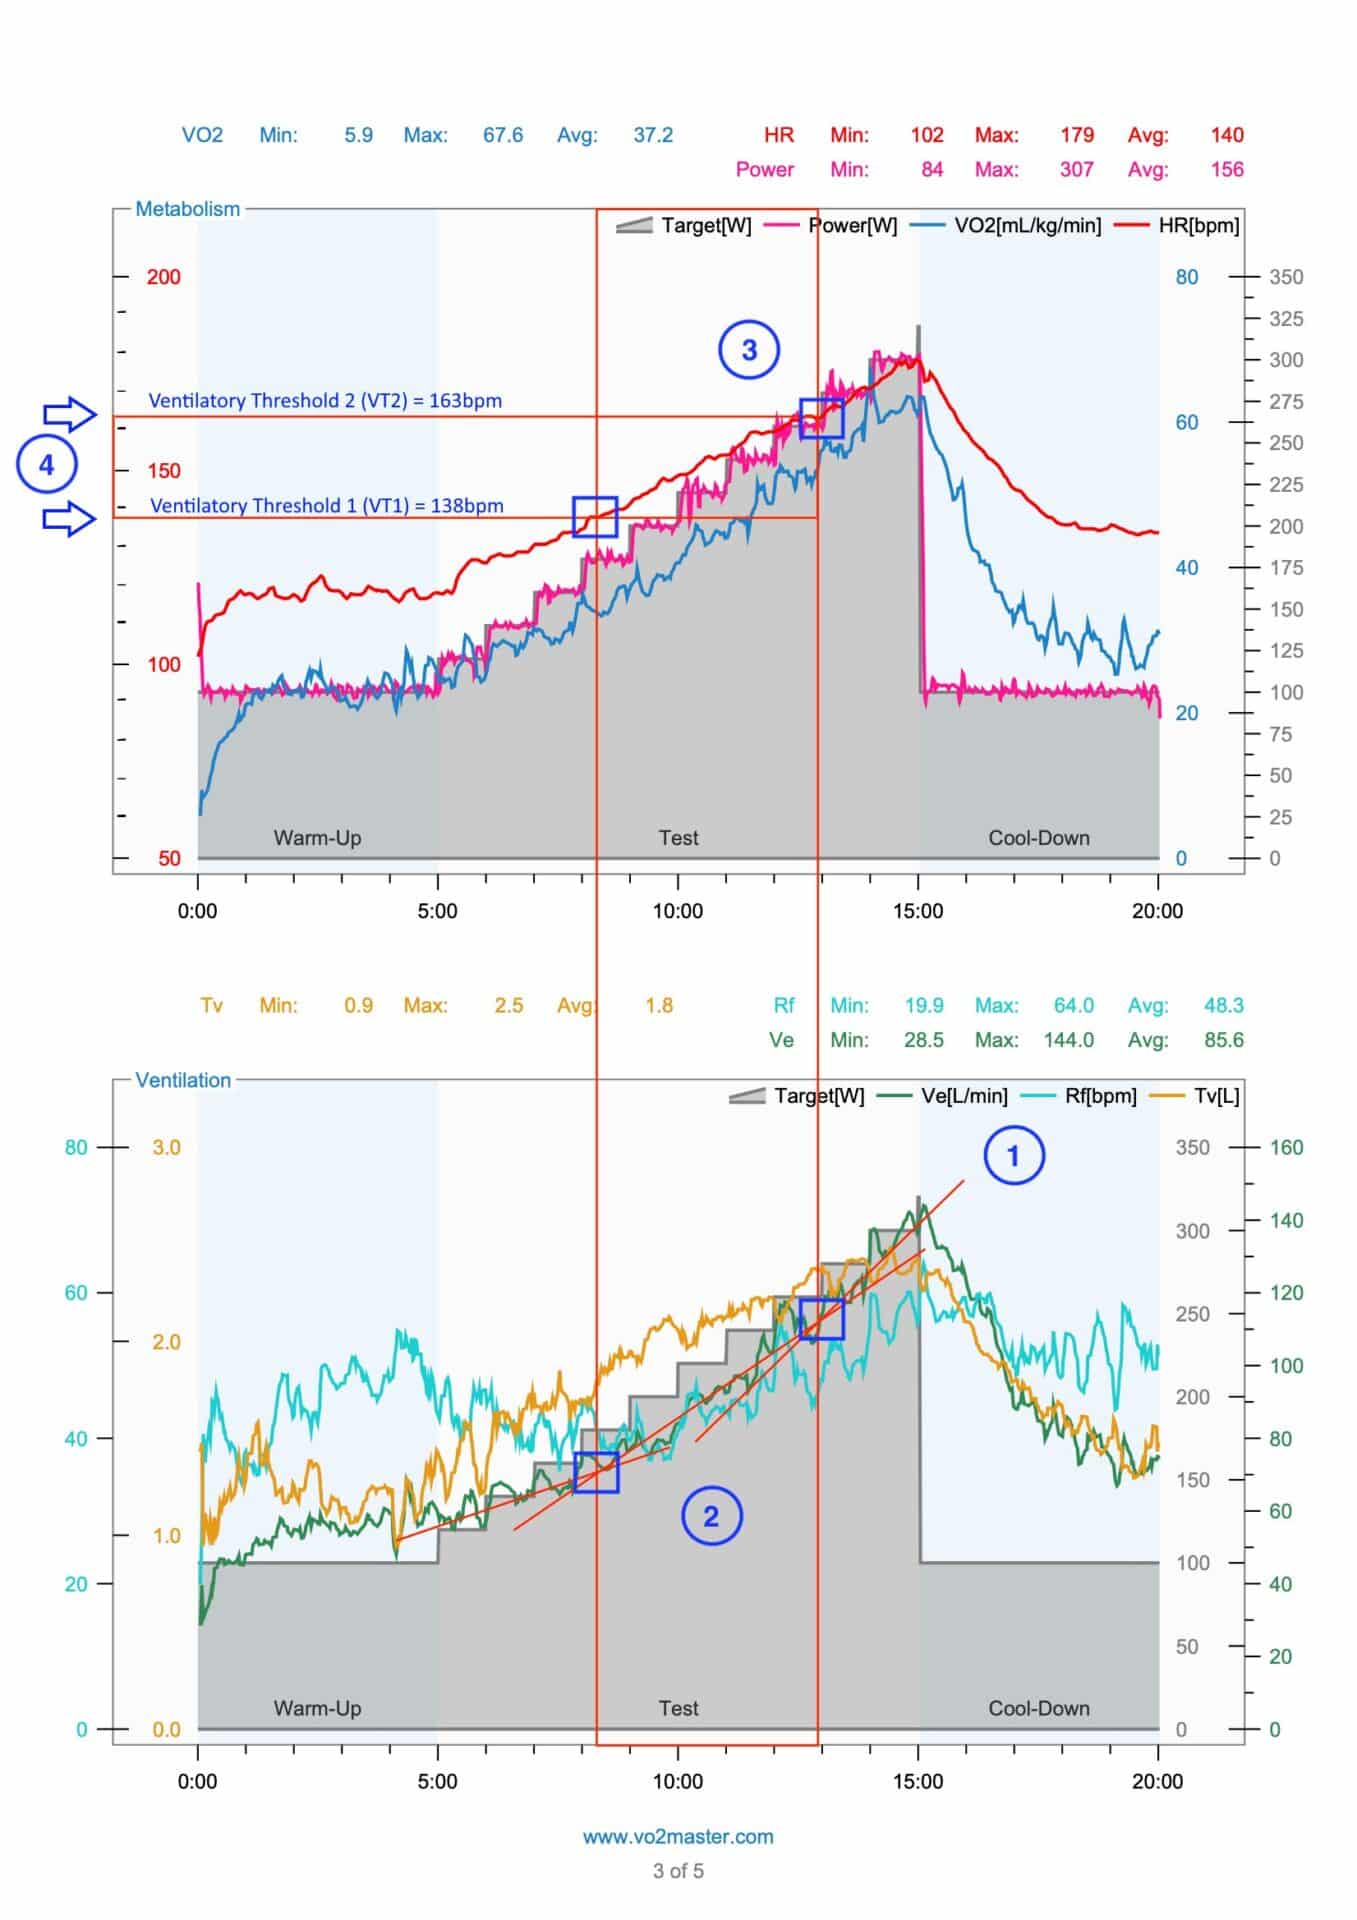
Here are trends that you might find helpful in manually identifying Ventilatory Thresholds. There are always exceptions.
- Tidal Volume (gold line) starts steady, increases between VT1 and VT2, and plateaus or even decreases after VT2.
- Ventilation (green line) increases throughout a Graded Exercise Test. The rate at which it increases, increases. In other words, the textbook ventilation curve will have three distinct, mostly straight lines which intersect about the two ventilatory thresholds.
- Respiratory Frequency (cyan or light blue line) typically increases rapidly right after VT2
- Tip: ensure heart rate starts below 100bpm such that data around the first ventilatory threshold is recorded. It is common for assessors to start athletes at too high an intensity, leading to VT1 not even being present in the data.
Please contact us should you have any questions, comments, or concerns.