How to Measure Exercise Efficiency
In this article, the first in our Advanced Series, we will be examining one method of accurately measuring exercise efficiency and economy.

Welcome to the VO2 Master Advanced Series of articles. In this collection of compositions, we will visit some of the more complex aspects of metabolic analysis. If you’re experienced in this subject, then this series is for you.
In this article, the first in our Advanced Series, we will be examining one method of accurately measuring exercise efficiency and economy.
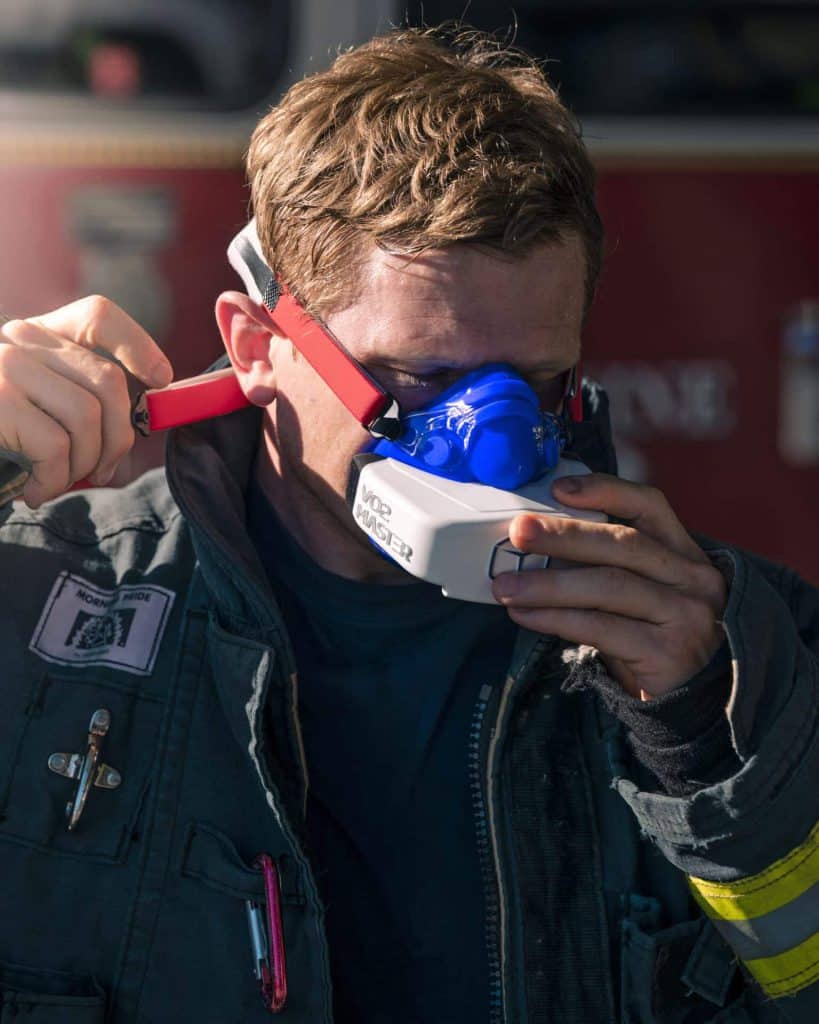
Before we dive in, it’s important to note that there are numerous protocols to examine efficiency, and, in fact, for any individual possessing a VO2 monitor (such as the portable VO2 Master Analyzer), testing efficiency can be completed relatively easily while training. However, for the purpose of this article, we will examine one specific method in detail to illustrate the logic and calculations taking place behind the scenes.
What is Exercise Efficiency?
Exercise efficiency, or economy of motion describes the bodies’ ability to translate chemical energy into locomotion. An in-depth description of these two terms was outline in the last blog post. In this post, the best practices for measuring economy/efficiency are described. One of the main benefits of measuring exercise economy is that it can be accomplished at low work-rates, meaning the test itself is not too taxing on an athlete, furthermore, the required testing apparatus is fairly minimal making it a very accessible measurement to complete.
Measuring Efficiency and Economy
While exercise efficiency/economy are generally used synonymously, their experimental determination is slightly different. Essentially, measurements of efficiency are the ratio of chemical energy required for a given power/speed output while measurements of economy describe the oxygen requirement for a speed/power output.
Efficiency – power output/energy required to maintain a speed or power
Economy – power output/oxygen required to maintain a speed or power
Given these differentiations, four major measures of efficiency and economy have been established, tested, and are now used to evaluate athletes and research participants. The four different measures are given below:
*Gross efficiency (%) – Work rate (W)/energy expenditure (J/s).
*Delta efficiency (%) – Change in work rate/change in energy expenditure
Cycling Economy (kJ/L) – Power output (J/s) * 60 (s/min) /oxygen consumption (L/min) / 1000 (kJ/J)
Running Economy (ml O2/kg/km) – VO2 * 60 min/hr * BM (kg)-1 * Running Speed (km/h)
In order to calculate efficiency values caloric energy expenditure must be estimated. The estimation of energy expenditure if dependent on both oxygen consumption and carbon dioxide production and can be determined by the following equation:
Energy Expenditure (J/s) – [(3.869 x VO2) + (1.195 x VCO2)] x (4.1896/60) x 1000
Required Testing Apparatus
- Treadmill, cycle or rowing ergometer.
- Metabolic device with an Oxygen sensor (No CO2 sensor necessary). *Denotes Variables that require CO2 Sensor
- Cadence control (when comparing between participant populations) such as a metronome.
Load/Speed Selection
Measuring efficiency/economy is highly dependent on the speed/power output and cadence therefore the selection of both load and cadence should be controlled in order to be able to compare individuals within a study or an individual at different times. For cycling, cadence should be between 80-100 bpm, while running should be somewhere around 180 bpm. When selecting speed/power output make sure that the intensity of the load selected is well below the athletes’ threshold so steady-state oxygen consumption can be reached. If you are testing a wide range of training capacities try to make the load low enough but not so low that athlete’s cycling or running gait is changed. Typically, power outputs of 75, 125, and 175w should suffice. When testing an individual have the athlete select their most natural/comfortable cadence and test them at three submaximal stages. Note these and any cadence differences between tests.
Example Experimental Protocol
In order to determine efficiency and economy variables for cycling or running at least two submaximal steady-state exercise stages must be completed especially when trying to measure Delta Efficiency. Typically, it takes the body 3-6 minutes of continuous load exercise to reach oxygen consumption steady state, therefore, the recommended stage duration should be greater than 5 minutes. When calculating these values it is advisable to use an average of the last 30s to 2 minutes of the stage to ensure steady state was attained. An example economy measurement protocol could be as follows:
- On a cycle ergometer, set the load to 75w and have the athlete maintain a cadence of 90rpm for 7 minutes,
- Maintaining 90rpm have the athlete cycle at 125w for 7 minutes,
- Increase the wattage to 175w and have the athlete maintain 90rpms for another 7 minutes.
- Total Time: 21 minutes
- Repeat test after each mesocycle (4-8 weeks)
The Benefits of Measurement
Calculating economy/efficiency values for an athlete or group of participants can allow for comparison of how well each individual is able to translate chemical energy into mechanical energy for movement. Testing these values requires very little testing equipment and does not require an athlete to dig too deep, in fact, this test could be used as a warm-up before an all-out session.
A Specific Example
Here’s an example of how to determine gross and delta efficiency, as well as cycling economy. In this case, the athlete performed two 7.5 minute stages of 50- and 100-watts, at 80 rpms on an electronically braked cycle ergometer. They were outfitted with a heart rate monitor and a mask that was attached to a gas analyzer to measure oxygen consumption and carbon dioxide production.
Upon completion of the test the output of oxygen consumption over time should look like Figure 1.

The next thing to do is find steady-state oxygen consumption over the final two minutes of each stage, each of the last two minutes are highlighted in Figure 2. As long as the participant reached steady state oxygen consumption (denoted by a trend line with a slope or an R2 approaching zero) it’s safe to average all values over the last two minutes of each stage.

Calculating Energy Expenditure
The next step is calculating energy expenditure from the equation below:
Energy Expenditure (EE) (J/s) – [(3.869 x VO2) + (1.195 x VCO2)] x (4.1896/60) x 1000 (Eq. 1)
Where VO2 is the average oxygen consumption and VCO2 is the average carbon dioxide production over the last two minutes of each stage. For this example the EE of 50 and 100 watts were 505.4 and 753.3, respectively.
Calculating Gross Efficiency
To determine the gross efficiency (GE) at 50 and 100 watts, use equation 2, below:
Gross efficiency (GE) (%) – Work rate (W)/energy expenditure (J/s) * 100 (Eq. 2)
All you need to do is divide 50 and 100 watts by the energy expenditure we already calculated. In this example the GE at 50 watts was 10% and the GE at 100 watts was 13.3%.
Calculating Delta Efficiency
To determine delta efficiency (DE) use equation 3, below:
Delta efficiency (%) – Change in work rate/change in energy expenditure * 100 (Eq. 3)
For this example the equation looks like (100 – 50watts)/(753.3 – 505.4(J/s)) which leads to a delta efficiency of 20.6%.
Calculating Cycling Economy
Finally, to determine cycling economy (EC) use equation 4, below:
Cycling Economy (kJ/L) – Power output (J/s)/oxygen consumption (L/s) (Eq. 4)
For this example the equation changes to 50 (J/s) * 60 (s/min) / 1.27 (L/min) / 1000 (J/kJ) = 2.36 (kJ/L) and 100 (J/s) * 60 (s/min) / 1.89 (L/min) / 1000 (J/kJ) = 3.17 (kJ/L). It should be noted that in order to get the proper output for EC you MUST convert minutes into seconds and J to kJ.
Summary
Calculating economy and efficiency at the same workload and cadence allows for athlete’s and participants to be compared to each other and other reference values . Gross efficiency for cycling typically ranges between 7.5-25.4% but it’s determination is highly dependent upon the power output used. As power output increases so does gross efficiency up to about 300w (where values range from 18-25%), then due to the recruitment of more type II muscle fibers efficiency begins to drop. Delta efficiency has been shown to vary from 20-30% in trained cyclists. Finally, cycling and running economy can vary up to 30 and 40%, respectively, between athletic populations. While these aren’t true reference values, comparing economy values between different participants can yield useful insights as to where each person lies regarding economy, thus laying the ground work for prescription of useful training interventions to those lacking a robust efficiency.
—
In the next Advanced Series article, we will present how to measure maximal oxygen consumption and include a specific example of interpreting a VO2max test.
